 19
19peptides
spectra
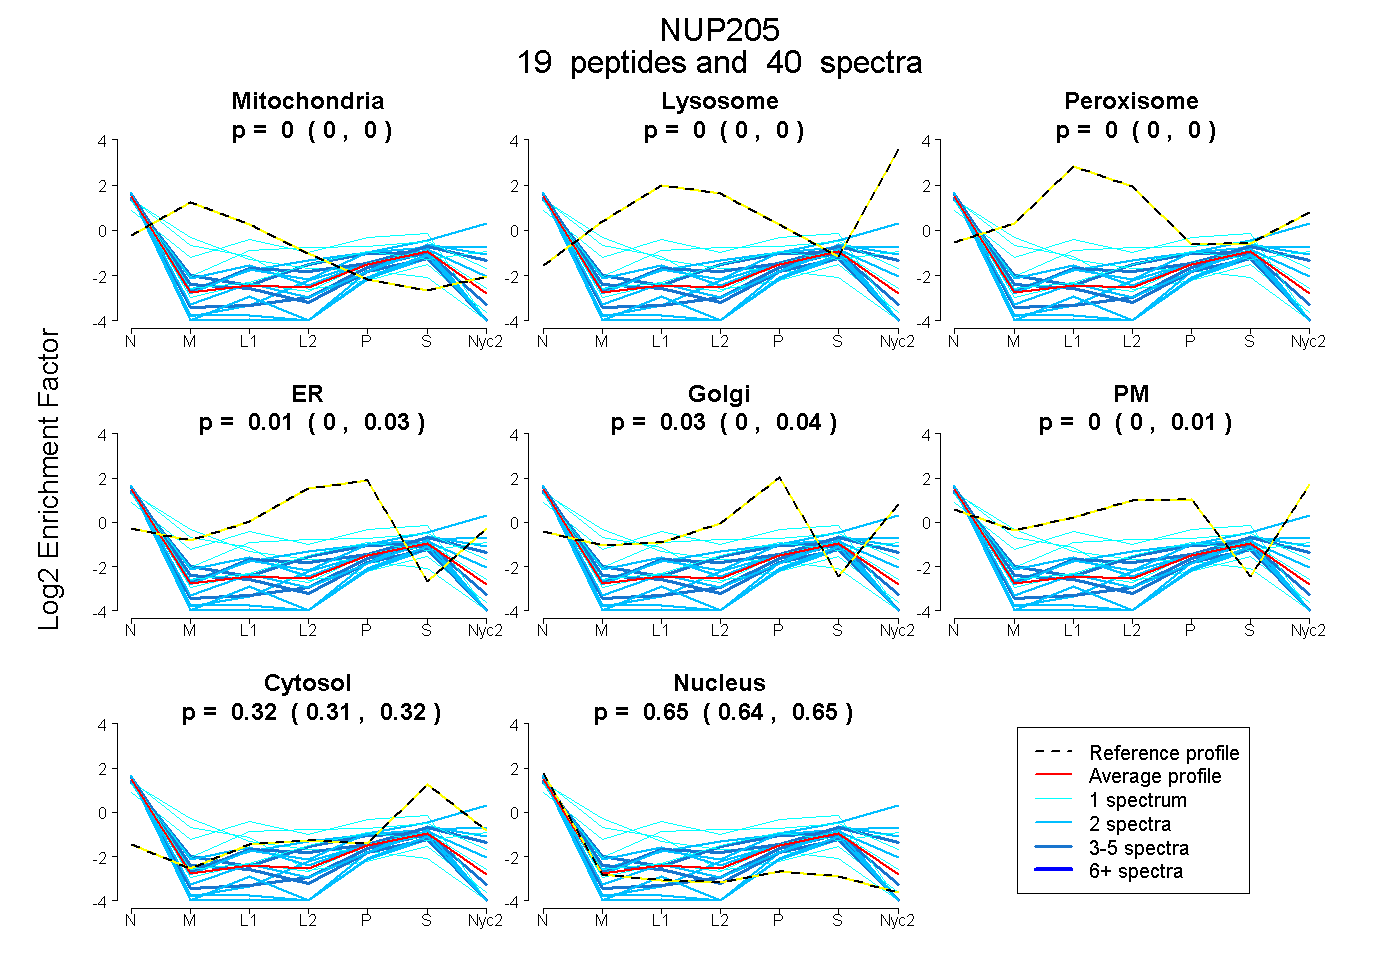
0.000 | 0.000
0.000 | 0.000
0.000 | 0.000
0.000 | 0.033
0.000 | 0.041
0.000 | 0.009
0.312 | 0.324
0.636 | 0.654
4peptides
spectra
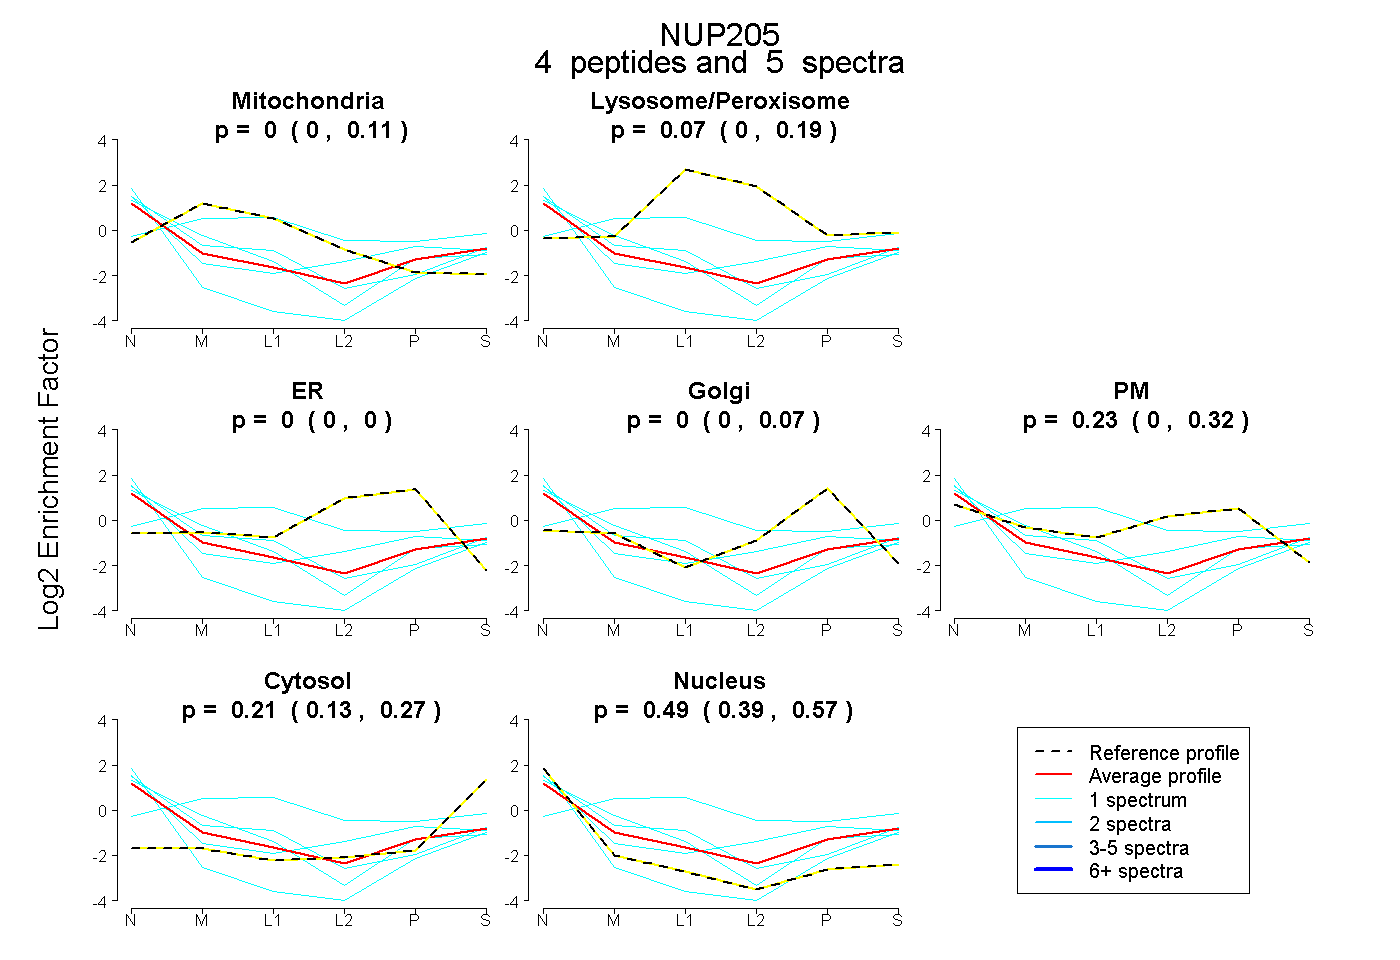
0.000 | 0.111
0.000 | 0.190
0.000 | 0.000
0.000 | 0.073
0.000 | 0.325
0.132 | 0.269
0.390 | 0.570
1peptide
spectrum
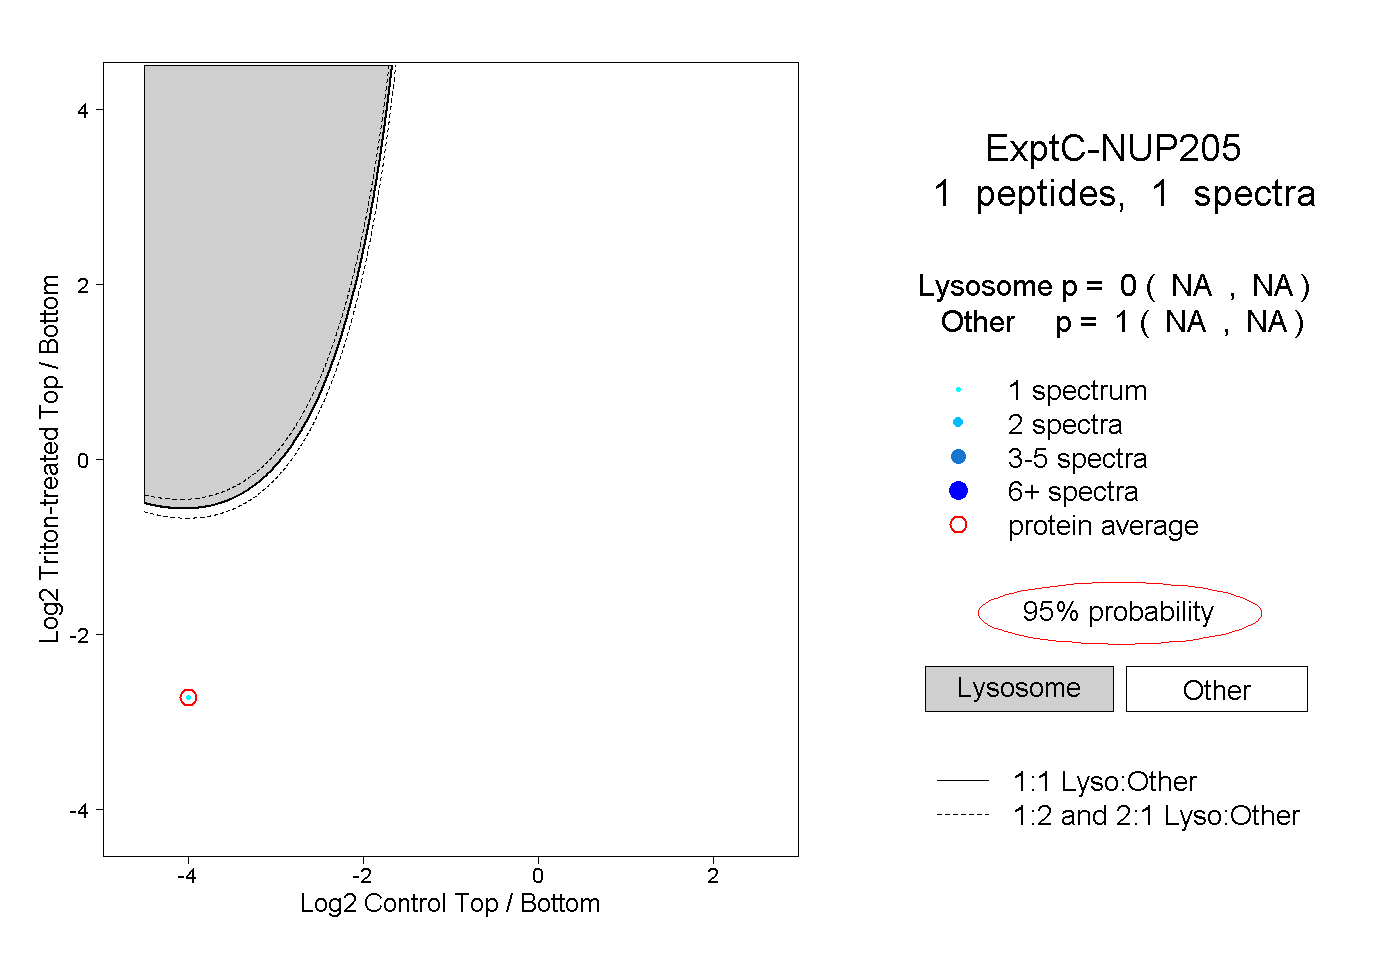
NA | NA
NA | NA