 12
12peptides
spectra
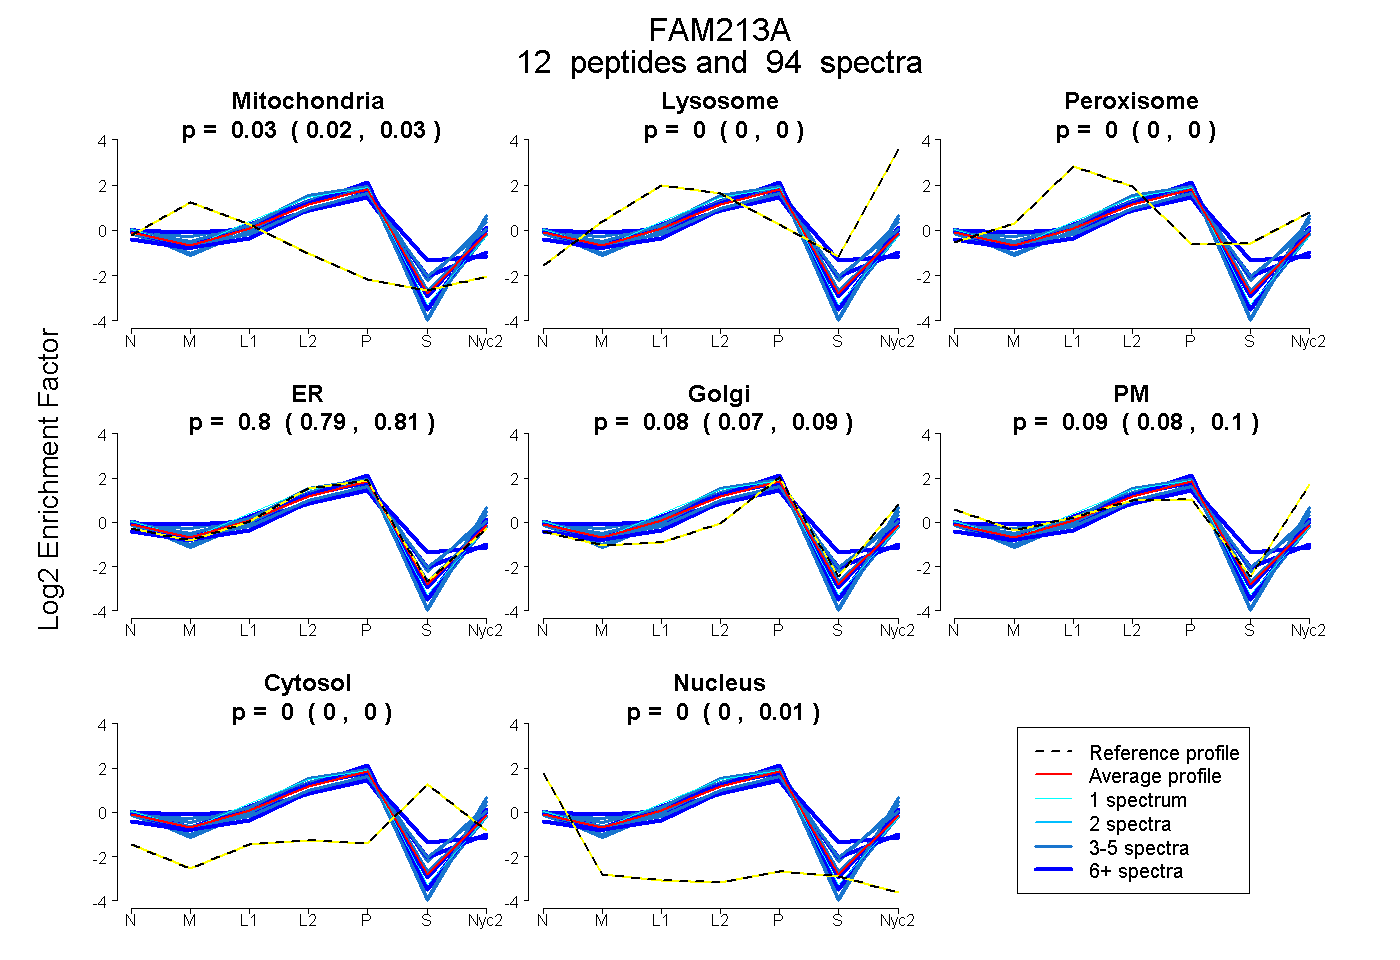
0.025 | 0.033
0.000 | 0.000
0.000 | 0.000
0.787 | 0.811
0.071 | 0.088
0.076 | 0.096
0.000 | 0.000
0.001 | 0.007
10peptides
spectra
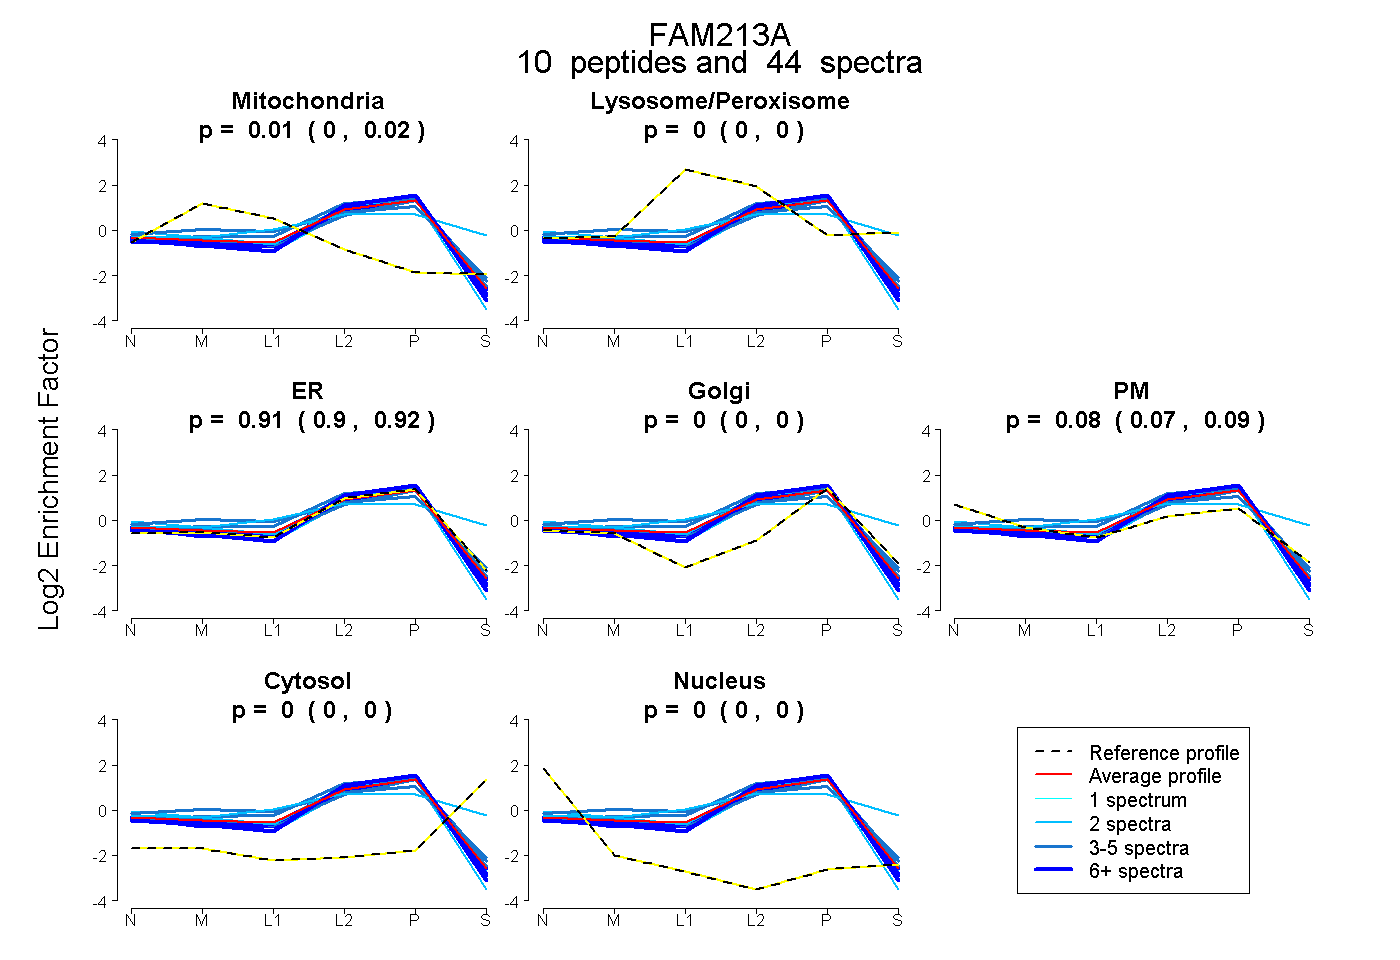
0.003 | 0.016
0.000 | 0.000
0.899 | 0.919
0.000 | 0.000
0.067 | 0.091
0.000 | 0.000
0.000 | 0.000
11peptides
spectra
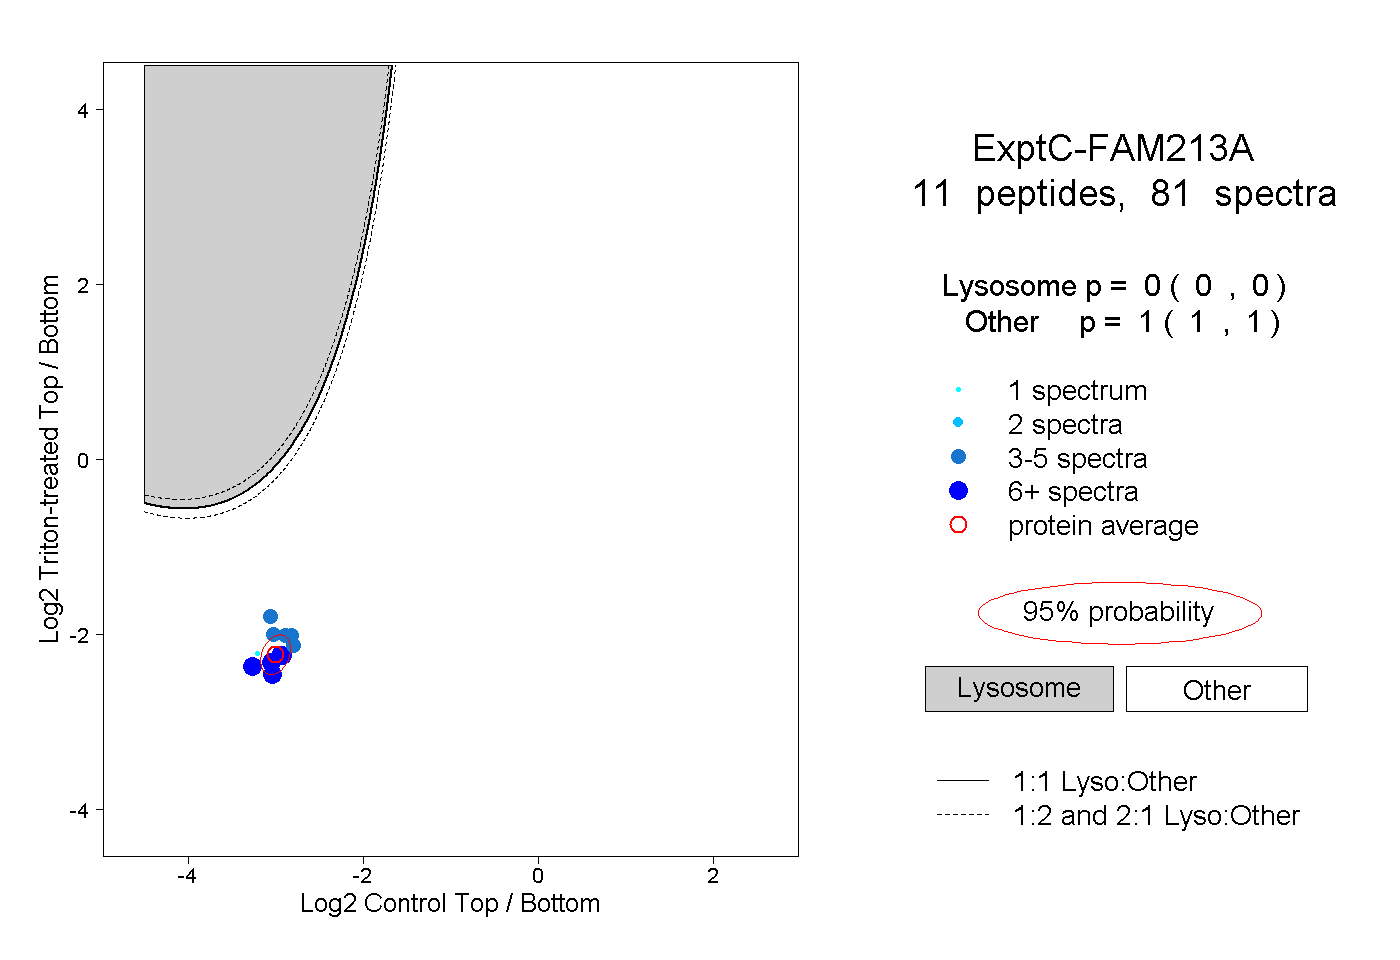
0.000 | 0.000
1.000 | 1.000
7peptides
spectra
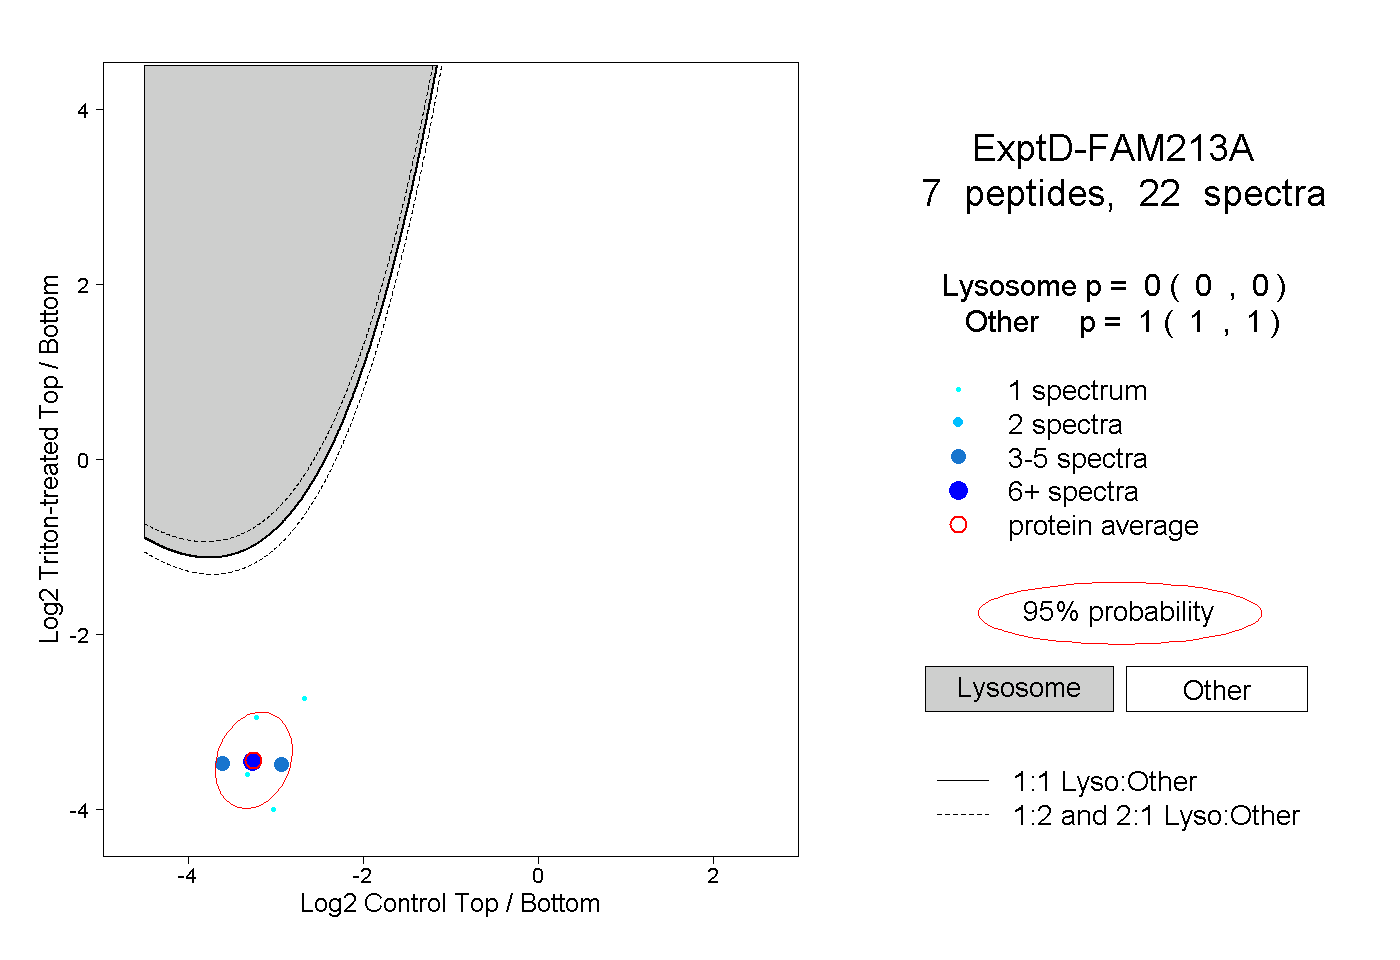
0.000 | 0.000
1.000 | 1.000