FAM213A
[ENSRNOP00000014819]
Main page
| | | Plot |
Mito |
Lyso |
|
Perox |
ER |
Golgi |
PM |
Cytosol |
Nucleus |
|
| Expt A |
 12
12
peptides |
94
spectra |
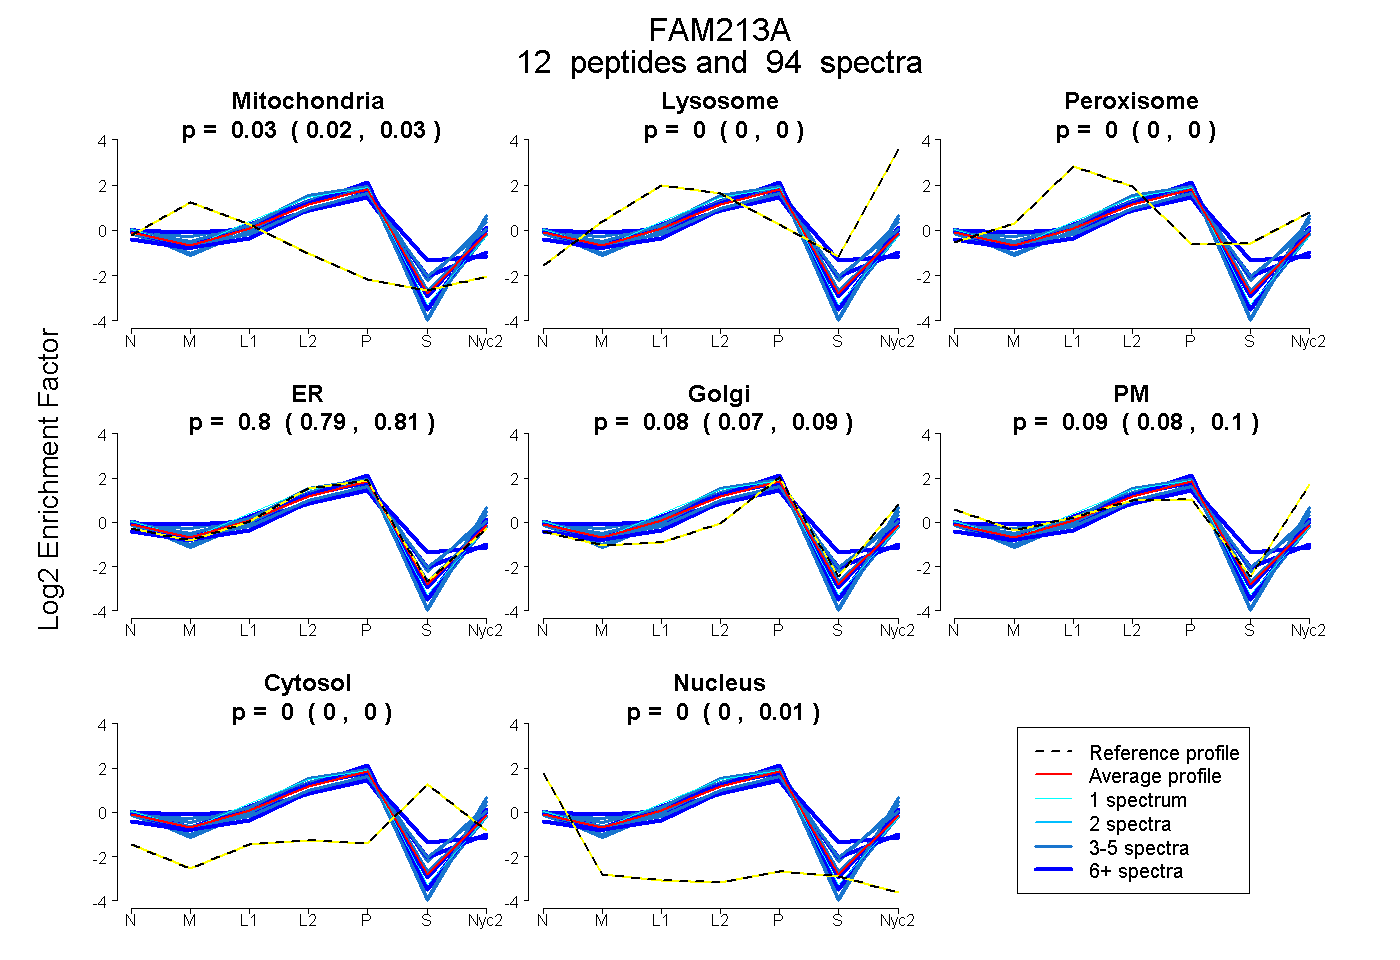 |
0.029
0.025 | 0.033 |
0.000
0.000 | 0.000 |
|
0.000
0.000 | 0.000 |
0.800
0.787 | 0.811 |
0.080
0.071 | 0.088 |
0.087
0.076 | 0.096 |
0.000
0.000 | 0.000 |
0.005
0.001 | 0.007 |
|
| | | Plot |
Mito |
|
Lyso or Perox |
|
ER |
Golgi |
PM |
Cytosol |
Nucleus |
|
| Expt B |
10
peptides |
44
spectra |
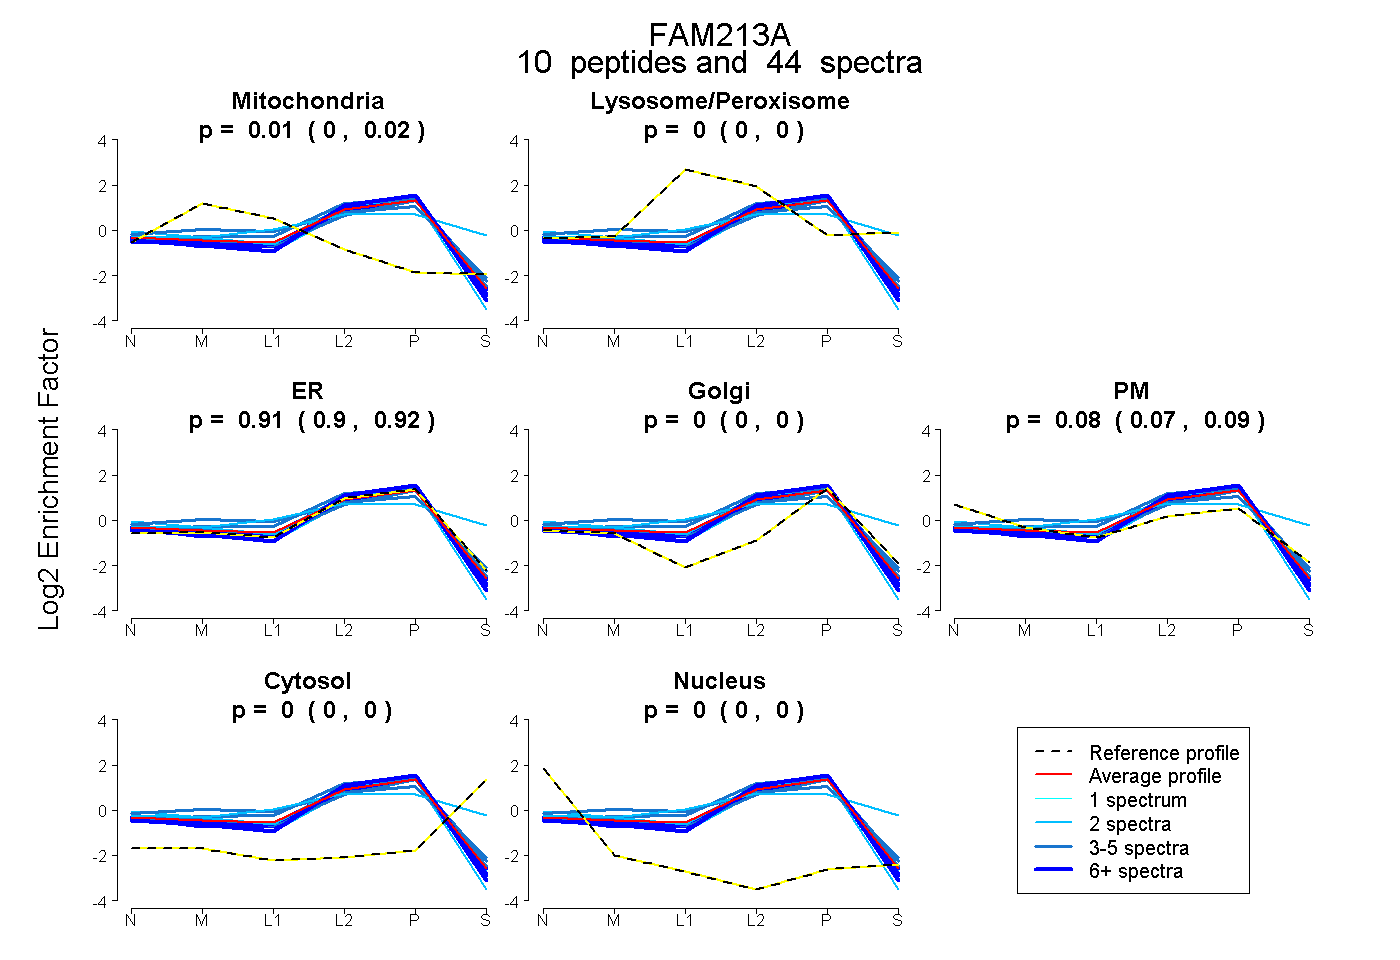 |
0.010
0.003 | 0.016 |
|
0.000
0.000 | 0.000 |
|
0.910
0.899 | 0.919 |
0.000
0.000 | 0.000 |
0.080
0.067 | 0.091 |
0.000
0.000 | 0.000 |
0.000
0.000 | 0.000 |
|
| | | Plot |
|
Lyso |
|
|
|
|
|
|
|
Other |
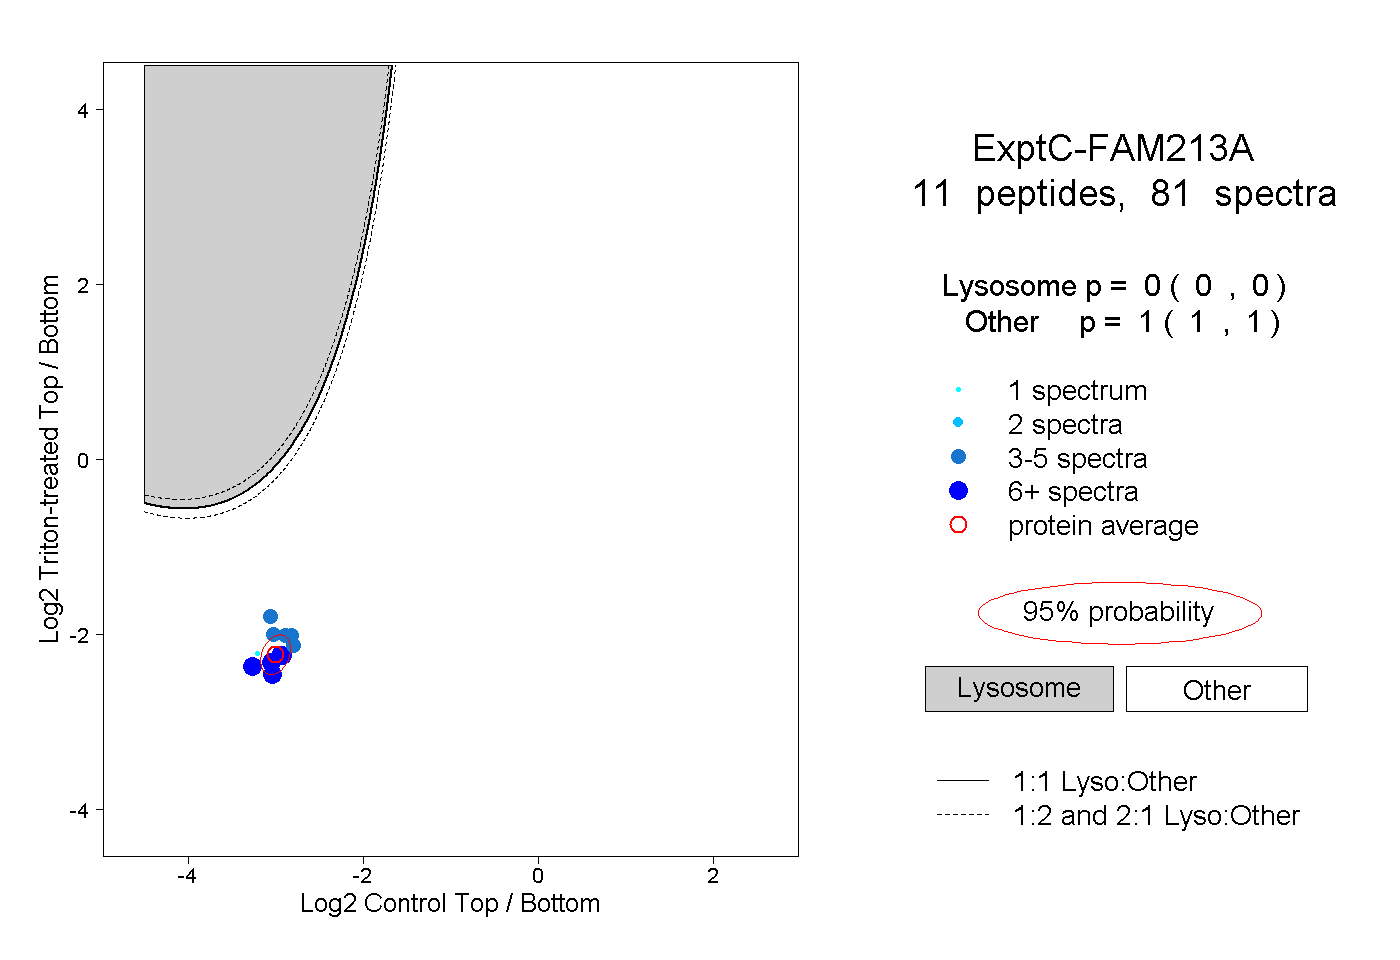
| Expt C |
11
peptides |
81
spectra |
 |
|
0.000
0.000 | 0.000 |
|
|
|
|
|
|
|
1.000
1.000 | 1.000 |
| 4 spectra, EVEDFQPYFK |
|
0.000 |
|
|
|
|
|
|
|
1.000 |
| 1 spectrum, MMLMGLVR |
|
0.000 |
|
|
|
|
|
|
|
1.000 |
| 7 spectra, QGVLLEHR |
|
0.000 |
|
|
|
|
|
|
|
1.000 |
| 4 spectra, LGVWYNSFR |
|
0.000 |
|
|
|
|
|
|
|
1.000 |
| 10 spectra, GEIFLDEK |
|
0.000 |
|
|
|
|
|
|
|
1.000 |
| 20 spectra, IKPQTPASR |
|
0.000 |
|
|
|
|
|
|
|
1.000 |
| 13 spectra, AEAADLMSLKPK |
|
0.000 |
|
|
|
|
|
|
|
1.000 |
| 5 spectra, LDELGVPLYAVVK |
|
0.000 |
|
|
|
|
|
|
|
1.000 |
| 9 spectra, RPGCFLCR |
|
0.000 |
|
|
|
|
|
|
|
1.000 |
| 4 spectra, NGAVIMAVR |
|
0.000 |
|
|
|
|
|
|
|
1.000 |
| 4 spectra, FYGPER |
|
0.000 |
|
|
|
|
|
|
|
1.000 |
| | | Plot |
|
Lyso |
|
|
|
|
|
|
|
Other |
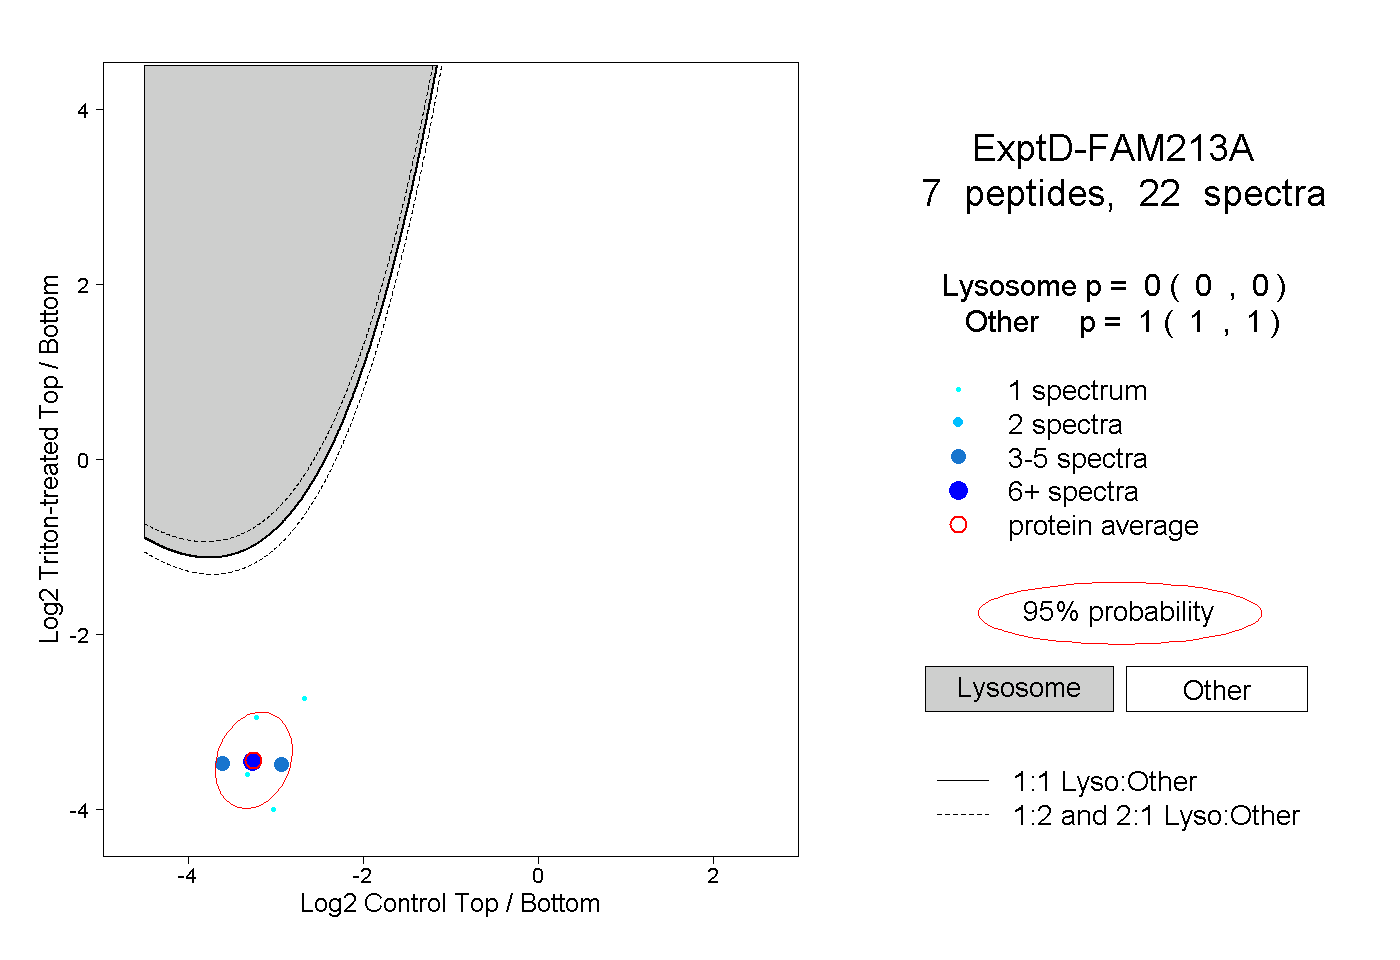
| Expt D |
7
peptides |
22
spectra |
 |
|
0.000
0.000 | 0.000 |
|
|
|
|
|
|
|
1.000
1.000 | 1.000 |