 12
12peptides
spectra
0.025 | 0.033
0.000 | 0.000
0.000 | 0.000
0.787 | 0.811
0.071 | 0.088
0.076 | 0.096
0.000 | 0.000
0.001 | 0.007
| Plot | Mito | Lyso | Perox | ER | Golgi | PM | Cytosol | Nucleus | |||||
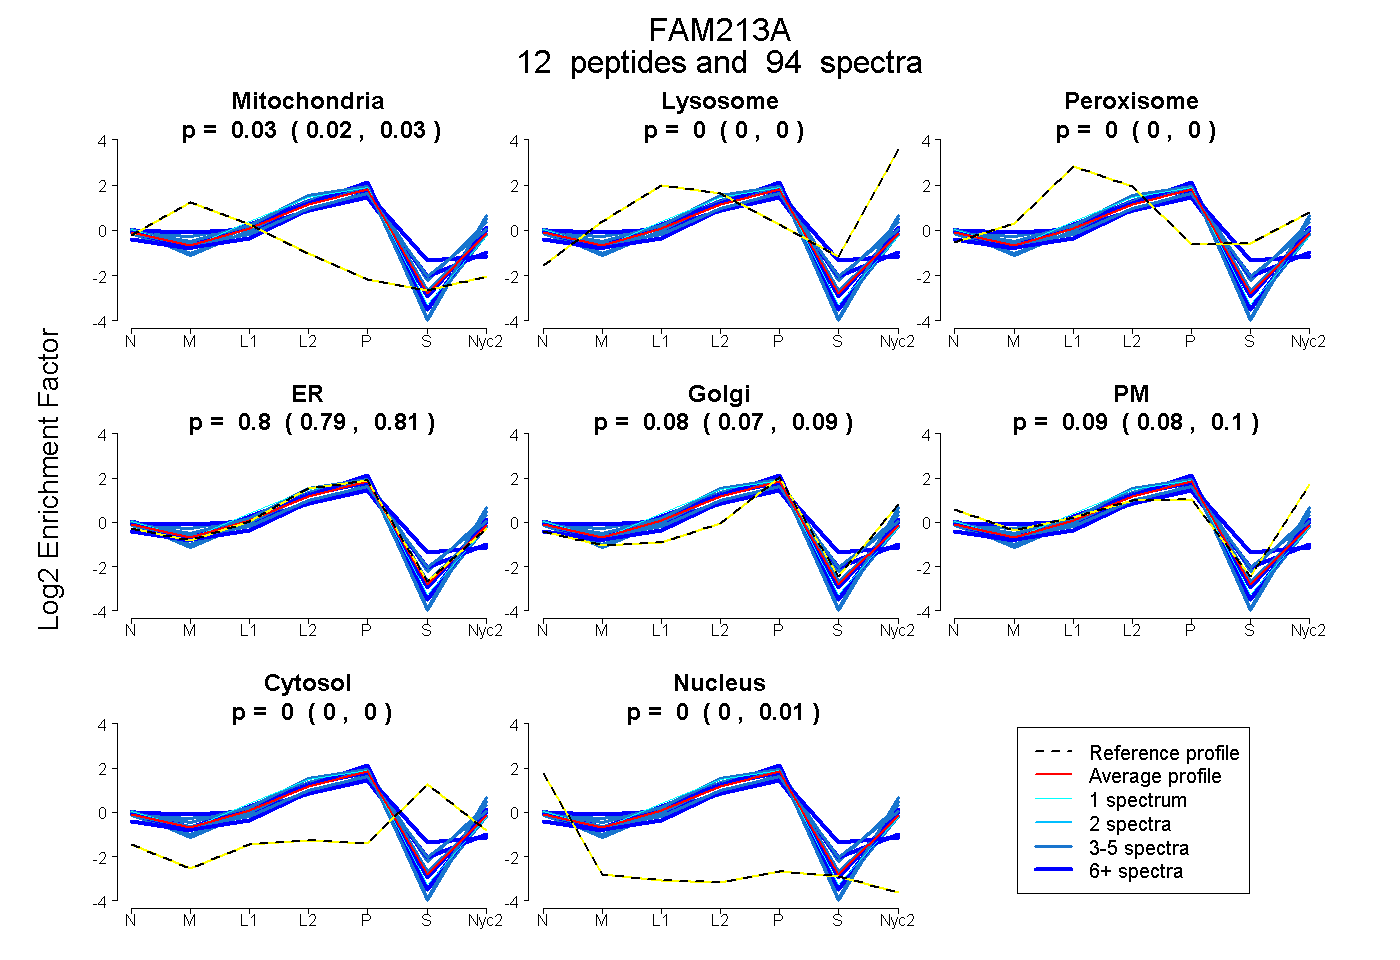
| Expt A |
12 peptides |
94 spectra |
|
0.029 0.025 | 0.033 |
0.000 0.000 | 0.000 |
0.000 0.000 | 0.000 |
0.800 0.787 | 0.811 |
0.080 0.071 | 0.088 |
0.087 0.076 | 0.096 |
0.000 0.000 | 0.000 |
0.005 0.001 | 0.007 |
| 3 spectra, EVEDFQPYFK | 0.000 | 0.000 | 0.000 | 0.964 | 0.008 | 0.019 | 0.000 | 0.010 | ||
| 11 spectra, MMLMGLVR | 0.000 | 0.000 | 0.000 | 0.848 | 0.115 | 0.037 | 0.000 | 0.000 | ||
| 1 spectrum, QGVLLEHR | 0.008 | 0.000 | 0.000 | 0.937 | 0.000 | 0.055 | 0.000 | 0.000 | ||
| 4 spectra, LGVWYNSFR | 0.000 | 0.000 | 0.000 | 0.709 | 0.031 | 0.259 | 0.000 | 0.000 | ||
| 22 spectra, GEIFLDEK | 0.009 | 0.000 | 0.000 | 0.796 | 0.000 | 0.191 | 0.000 | 0.004 | ||
| 5 spectra, AALEYLEDIDLK | 0.105 | 0.000 | 0.000 | 0.665 | 0.131 | 0.098 | 0.000 | 0.000 | ||
| 12 spectra, IKPQTPASR | 0.188 | 0.000 | 0.000 | 0.778 | 0.000 | 0.000 | 0.034 | 0.000 | ||
| 3 spectra, AEAADLMSLKPK | 0.000 | 0.026 | 0.000 | 0.671 | 0.156 | 0.125 | 0.022 | 0.000 | ||
| 3 spectra, LDELGVPLYAVVK | 0.000 | 0.000 | 0.000 | 0.864 | 0.082 | 0.028 | 0.000 | 0.026 | ||
| 20 spectra, RPGCFLCR | 0.011 | 0.000 | 0.000 | 0.778 | 0.000 | 0.000 | 0.188 | 0.022 | ||
| 5 spectra, NGAVIMAVR | 0.000 | 0.000 | 0.000 | 0.668 | 0.000 | 0.332 | 0.000 | 0.000 | ||
| 5 spectra, VNLLSVLEAVK | 0.015 | 0.000 | 0.029 | 0.601 | 0.179 | 0.109 | 0.066 | 0.000 |
| Plot | Mito | Lyso or Perox | ER | Golgi | PM | Cytosol | Nucleus | ||||||
| Expt B |
10 peptides |
44 spectra |
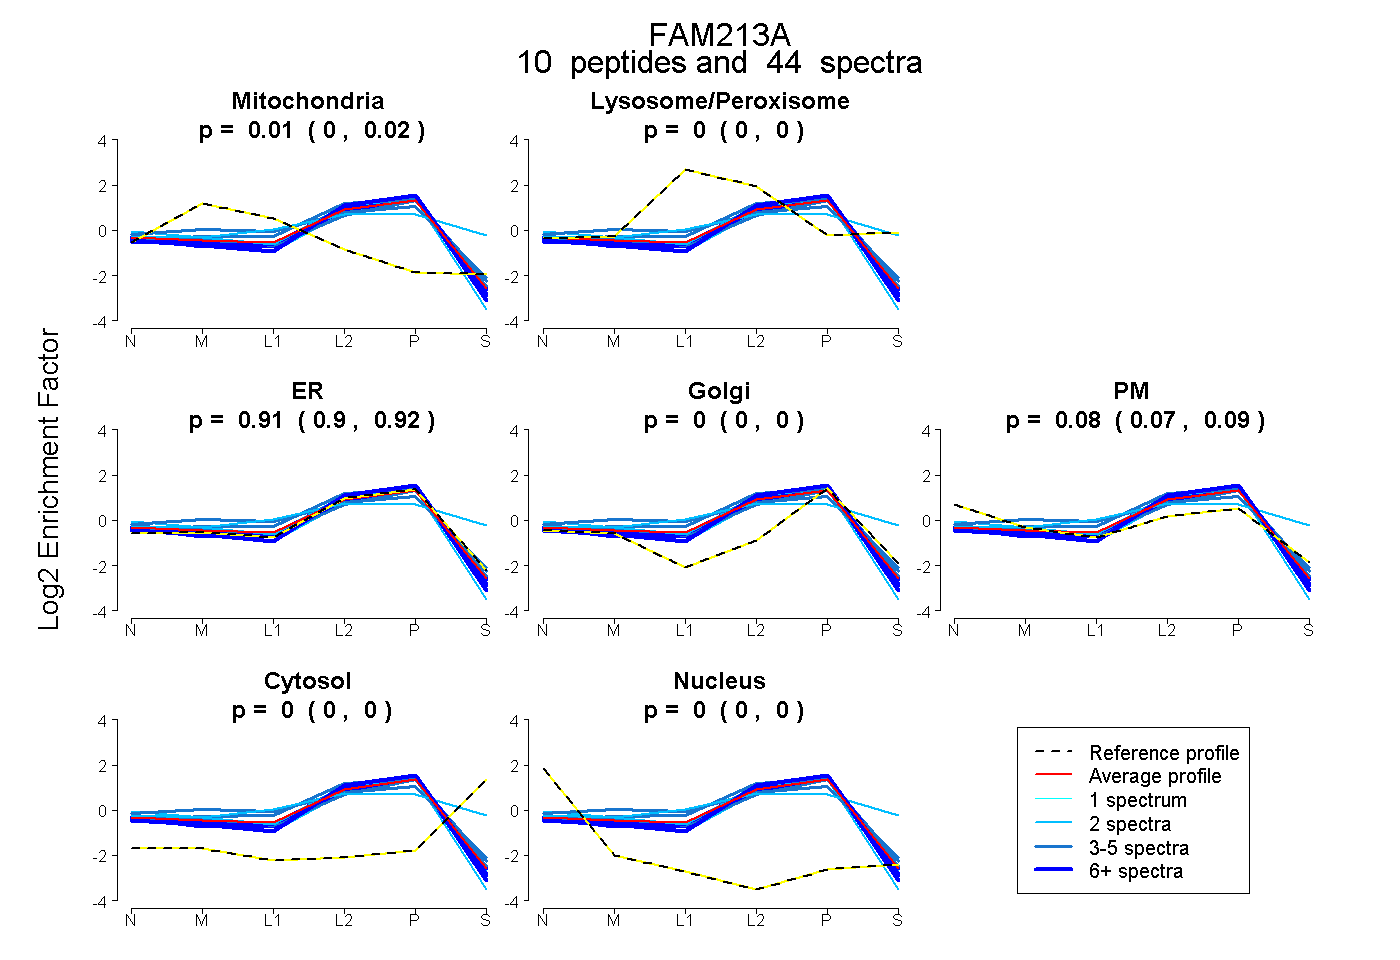 |
0.010 0.003 | 0.016 |
0.000 0.000 | 0.000 |
0.910 0.899 | 0.919 |
0.000 0.000 | 0.000 |
0.080 0.067 | 0.091 |
0.000 0.000 | 0.000 |
0.000 0.000 | 0.000 |
|||
| Plot | Lyso | Other | |||||||||||
| Expt C |
11 peptides |
81 spectra |
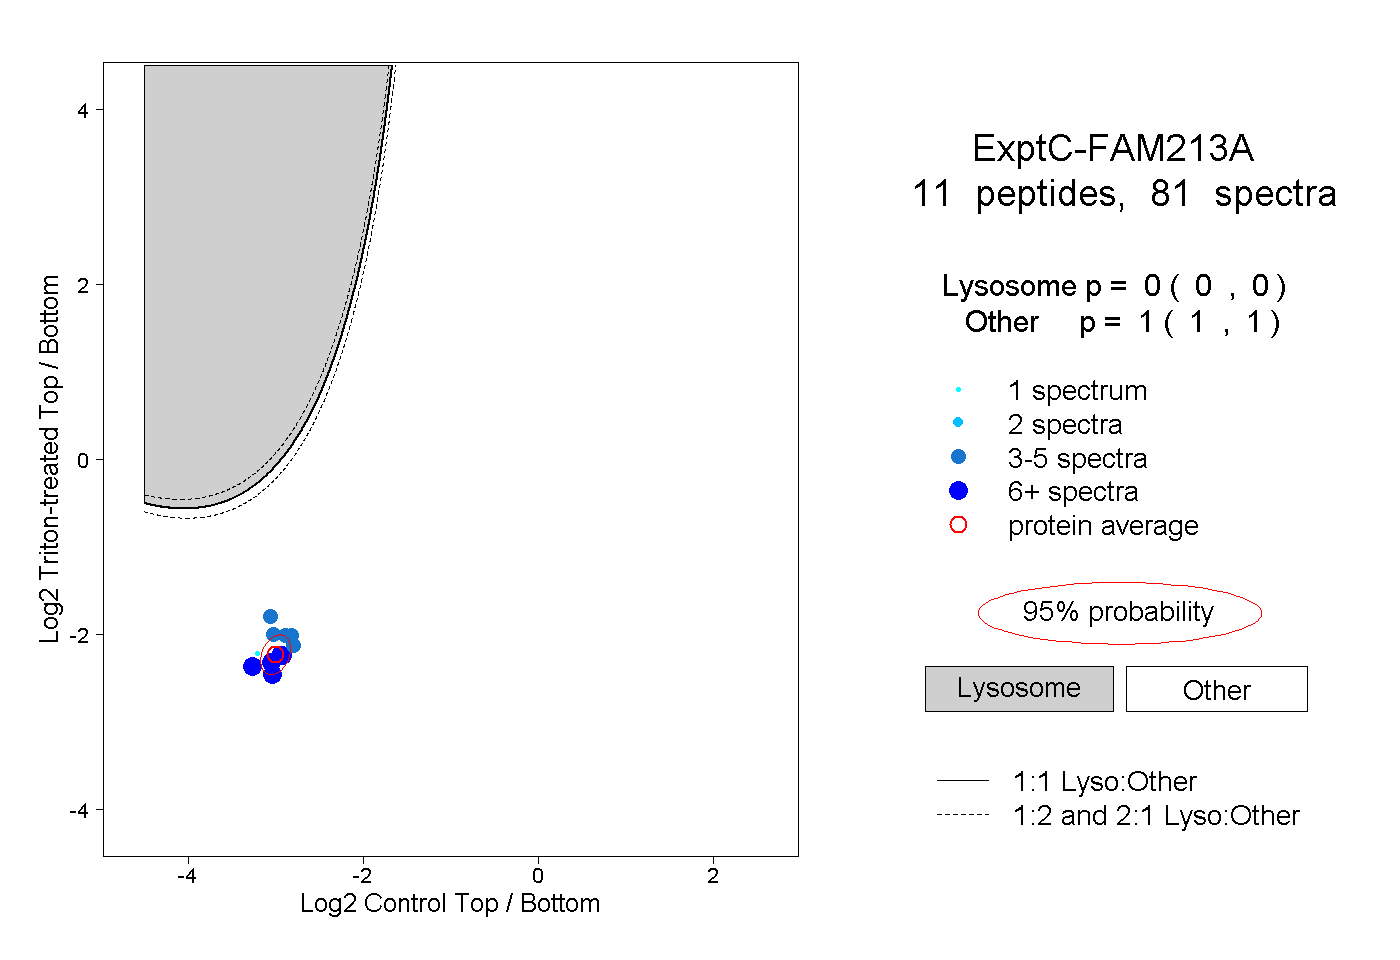 |
0.000 0.000 | 0.000 |
1.000 1.000 | 1.000 |
||||||||
| Plot | Lyso | Other | |||||||||||
| Expt D |
7 peptides |
22 spectra |
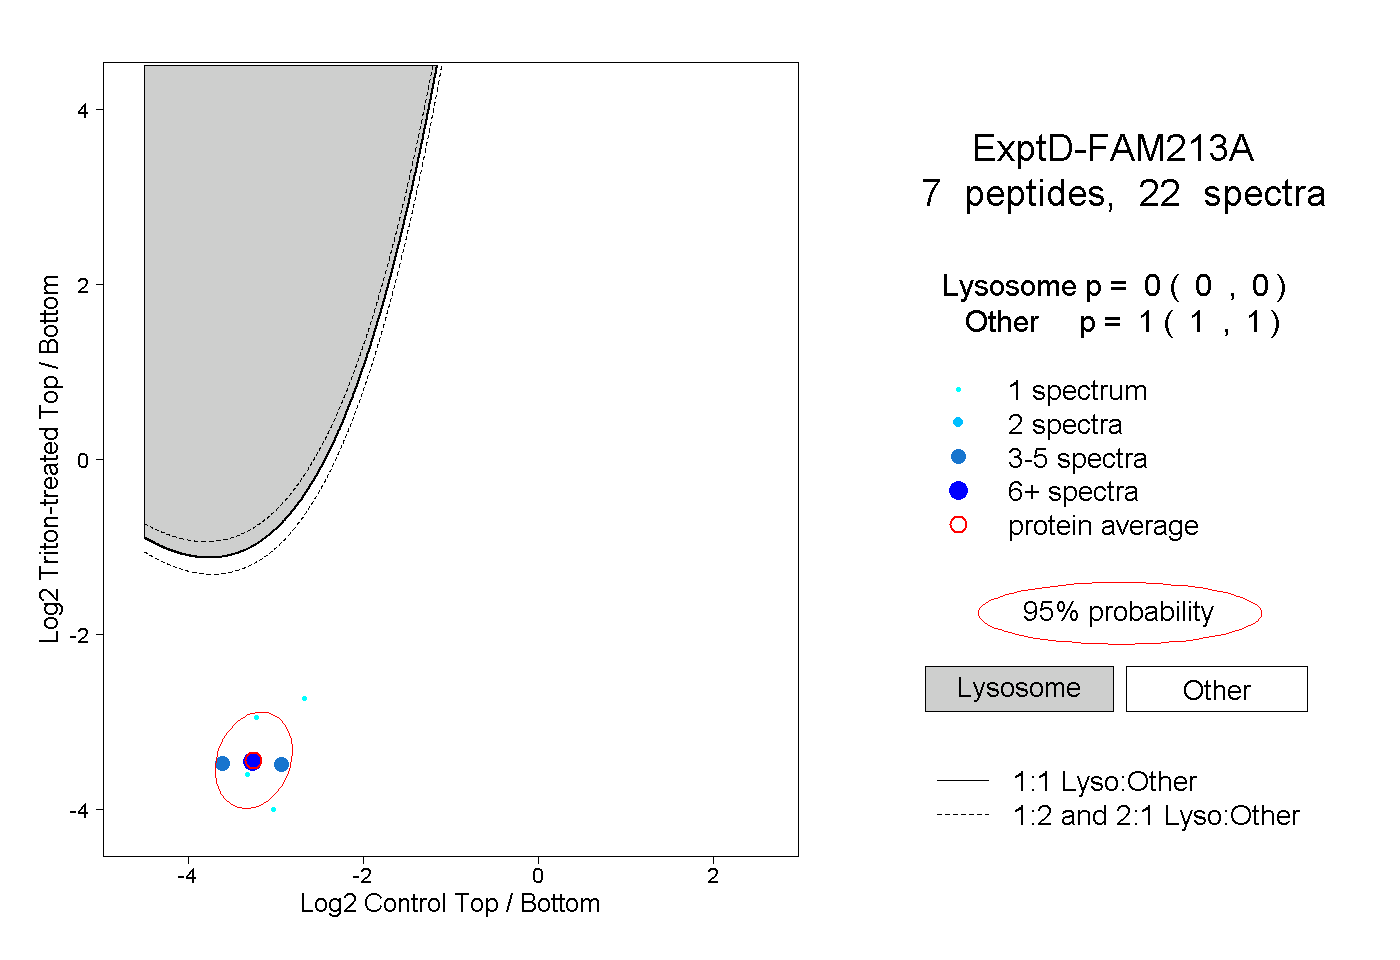 |
0.000 0.000 | 0.000 |
1.000 1.000 | 1.000 |