 1
1peptide
spectra
0.000 | 0.000
0.000 | 0.000
0.466 | 0.533
0.200 | 0.382
0.037 | 0.168
0.000 | 0.000
0.000 | 0.025
0.068 | 0.097
1peptide
spectrum
NA | NA
NA | NA
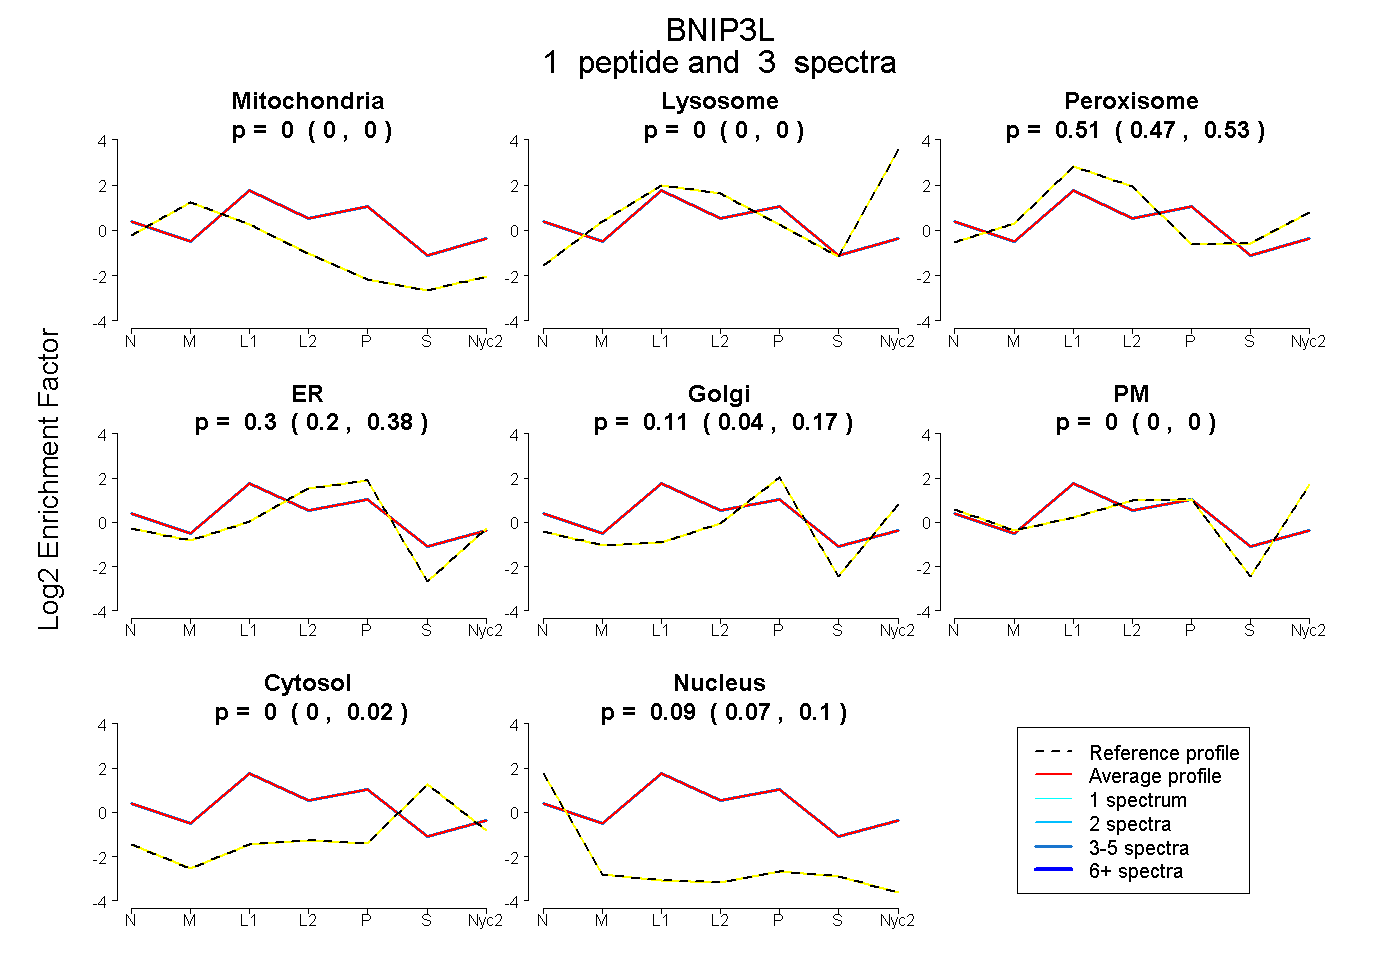
| Plot | Mito | Lyso | Perox | ER | Golgi | PM | Cytosol | Nucleus | |||||
| Expt A |
1 peptide |
3 spectra |
|
0.000 0.000 | 0.000 |
0.000 0.000 | 0.000 |
0.506 0.466 | 0.533 |
0.299 0.200 | 0.382 |
0.108 0.037 | 0.168 |
0.000 0.000 | 0.000 |
0.000 0.000 | 0.025 |
0.087 0.068 | 0.097 |
||
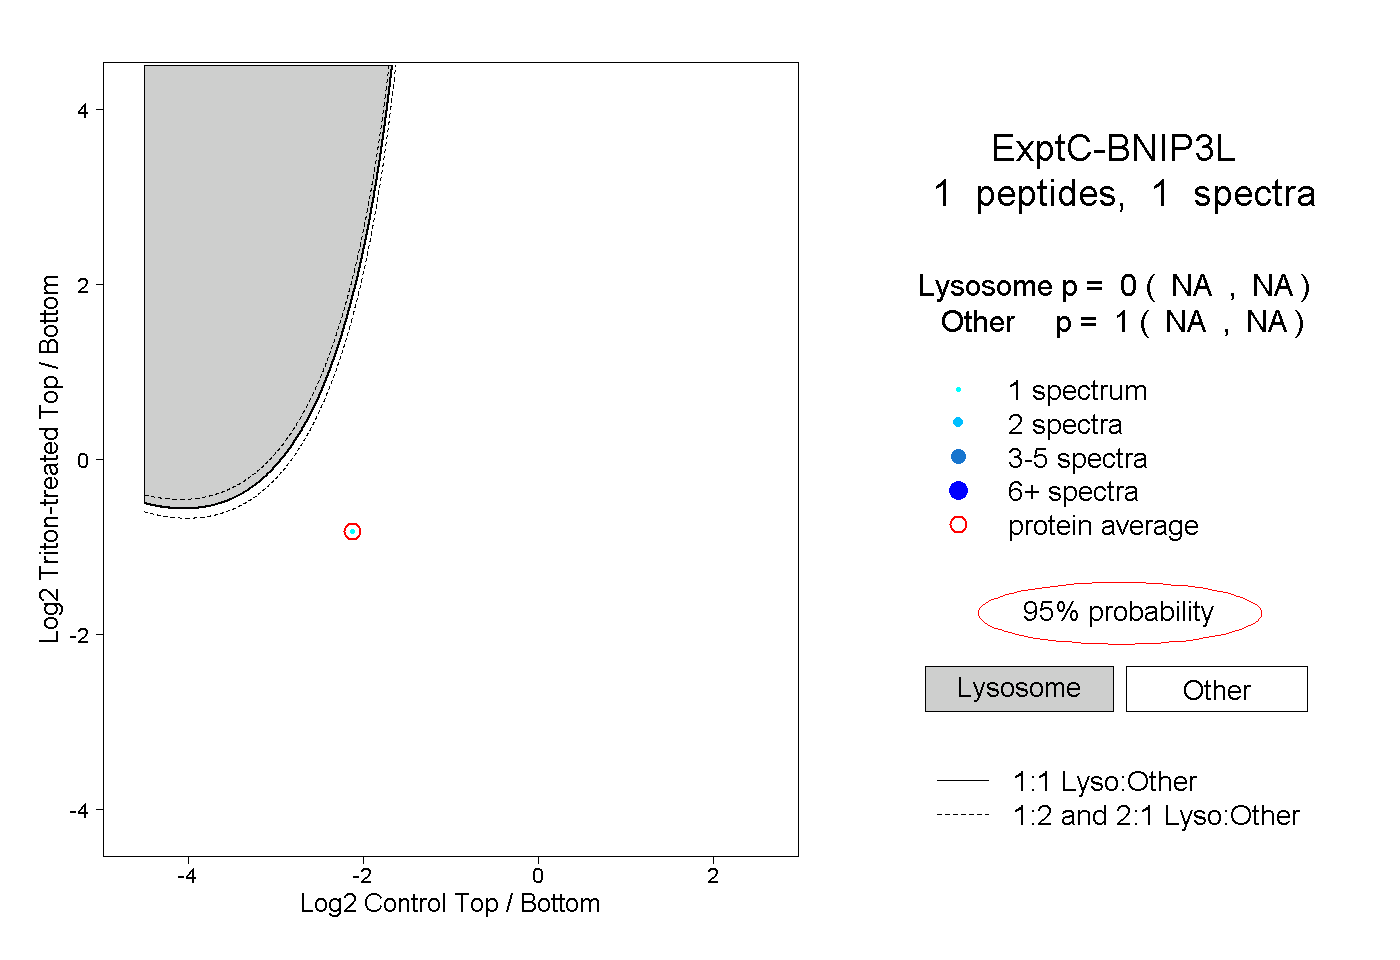
| Plot | Lyso | Other | |||||||||||
| Expt C |
1 peptide |
1 spectrum |
|
0.000 NA | NA |
1.000 NA | NA |