21
21peptides
spectra
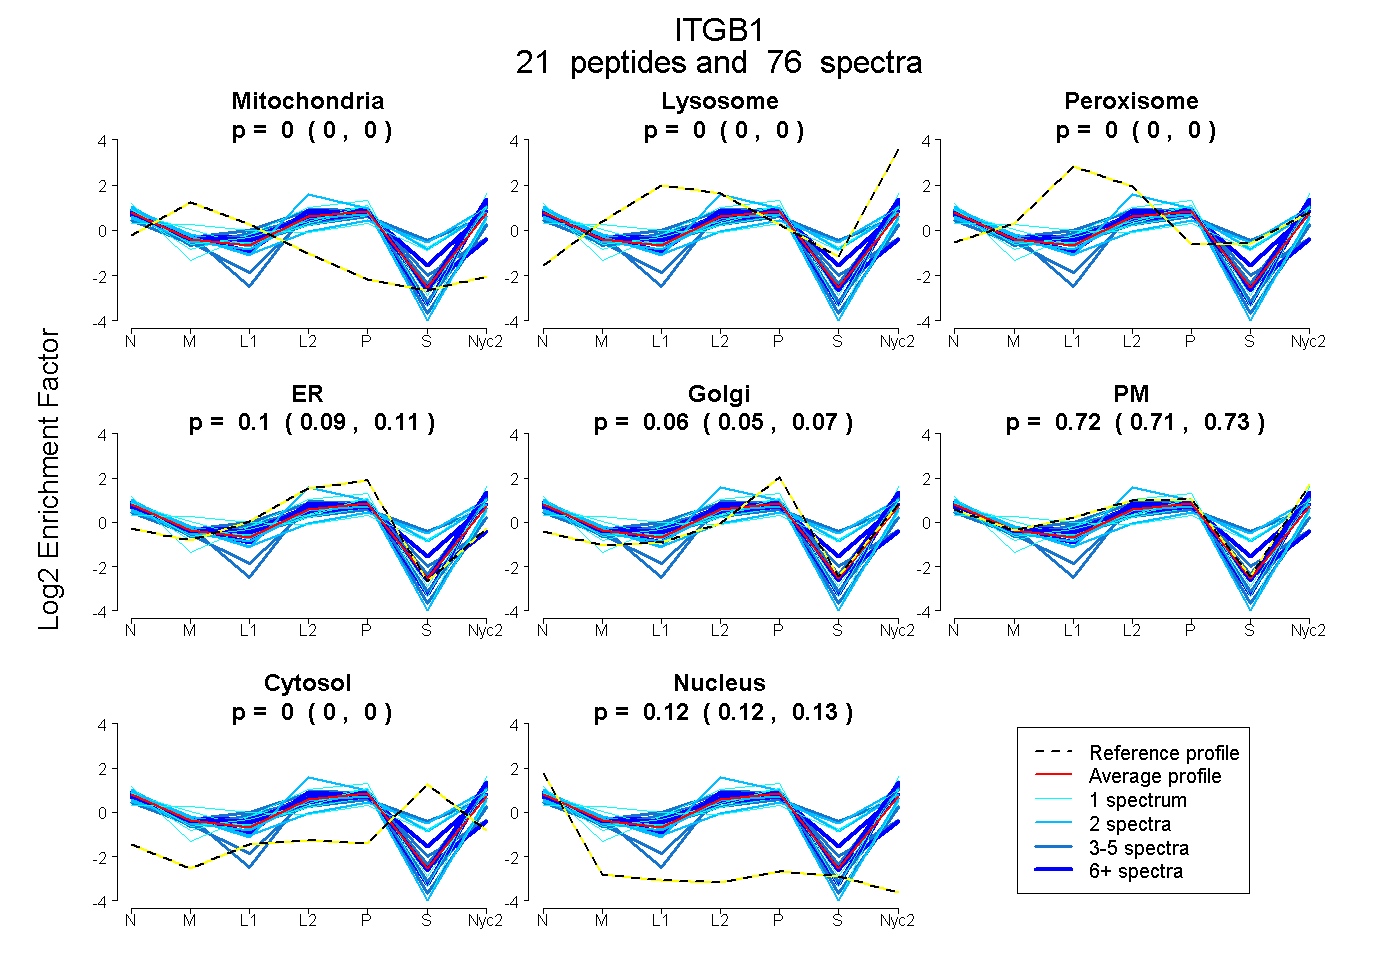
0.000 | 0.004
0.000 | 0.000
0.000 | 0.000
0.085 | 0.108
0.048 | 0.069
0.709 | 0.725
0.000 | 0.000
0.122 | 0.126
5peptides
spectra
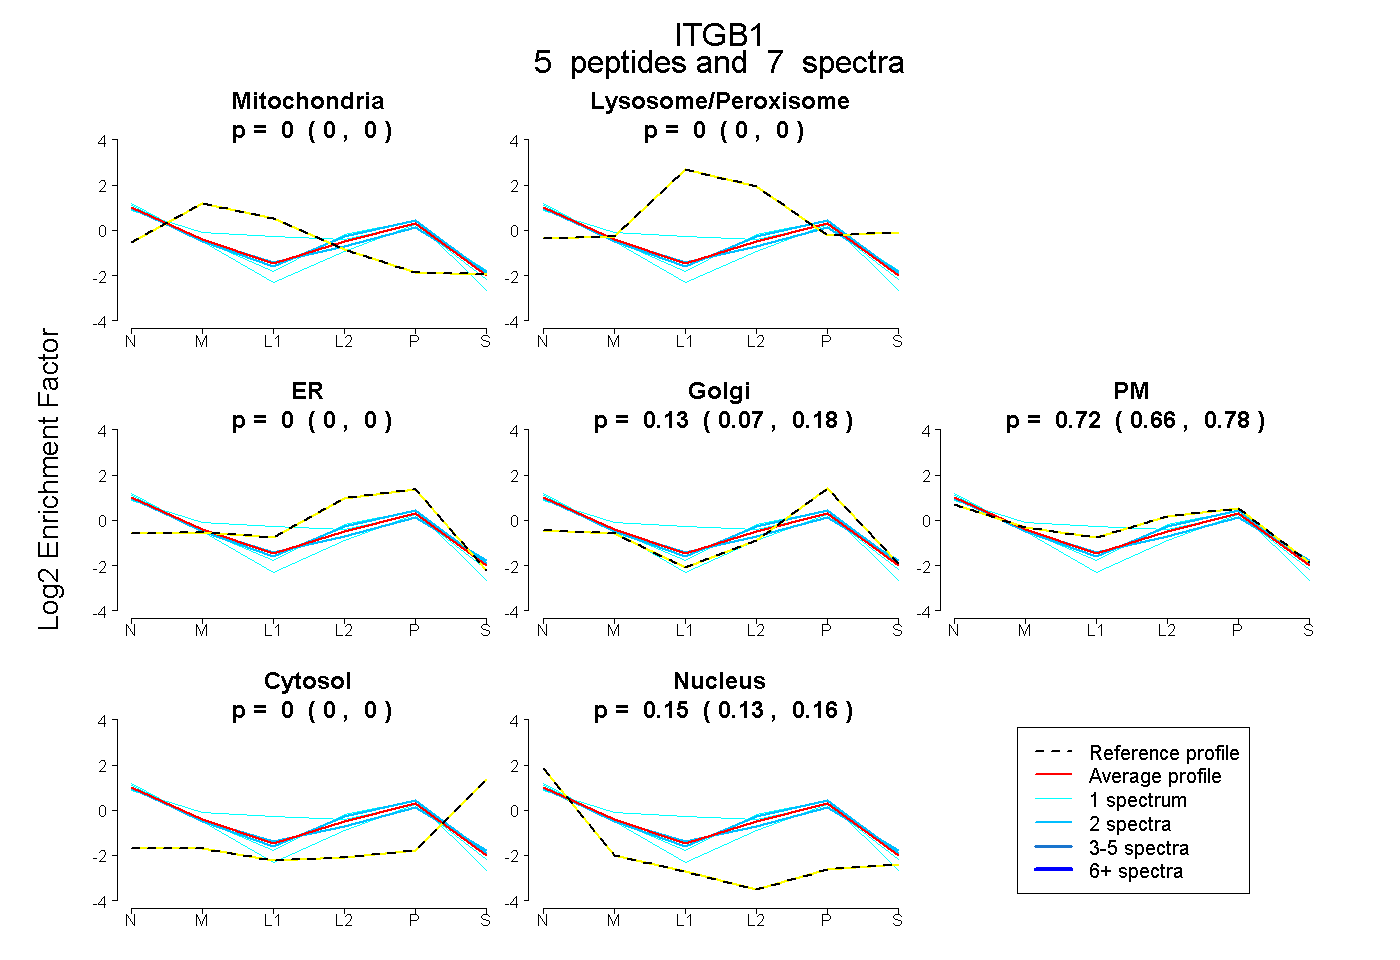
0.000 | 0.000
0.000 | 0.000
0.000 | 0.000
0.068 | 0.177
0.656 | 0.779
0.000 | 0.000
0.132 | 0.164