 24
24peptides
spectra
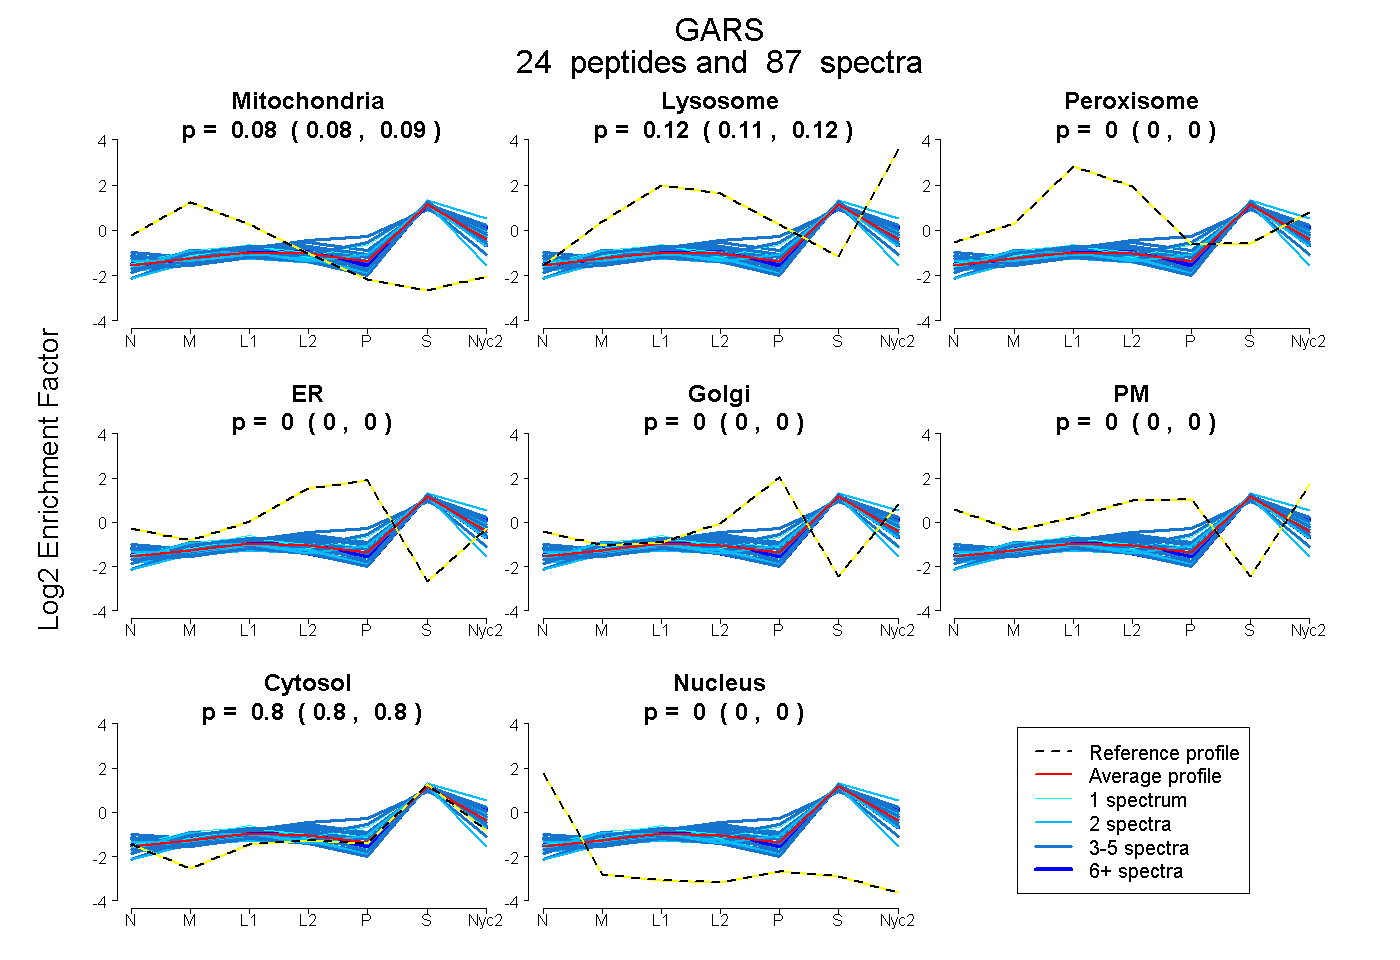
0.082 | 0.086
0.113 | 0.118
0.000 | 0.000
0.000 | 0.000
0.000 | 0.000
0.000 | 0.000
0.799 | 0.801
0.000 | 0.000
9peptides
spectra
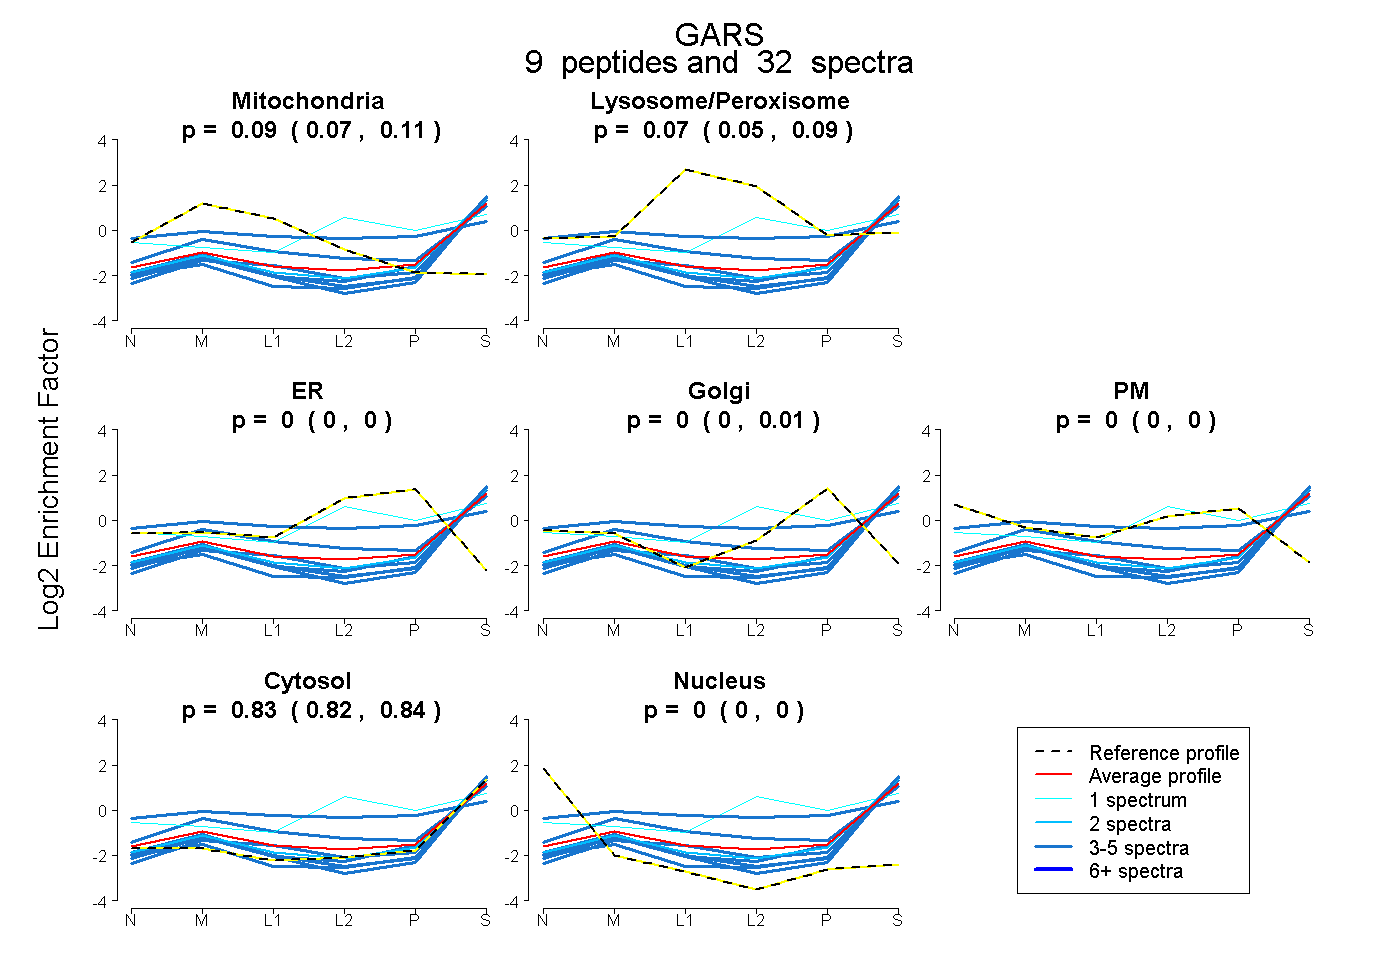
0.075 | 0.108
0.052 | 0.089
0.000 | 0.000
0.000 | 0.006
0.000 | 0.000
0.822 | 0.843
0.000 | 0.000
25peptides
spectra
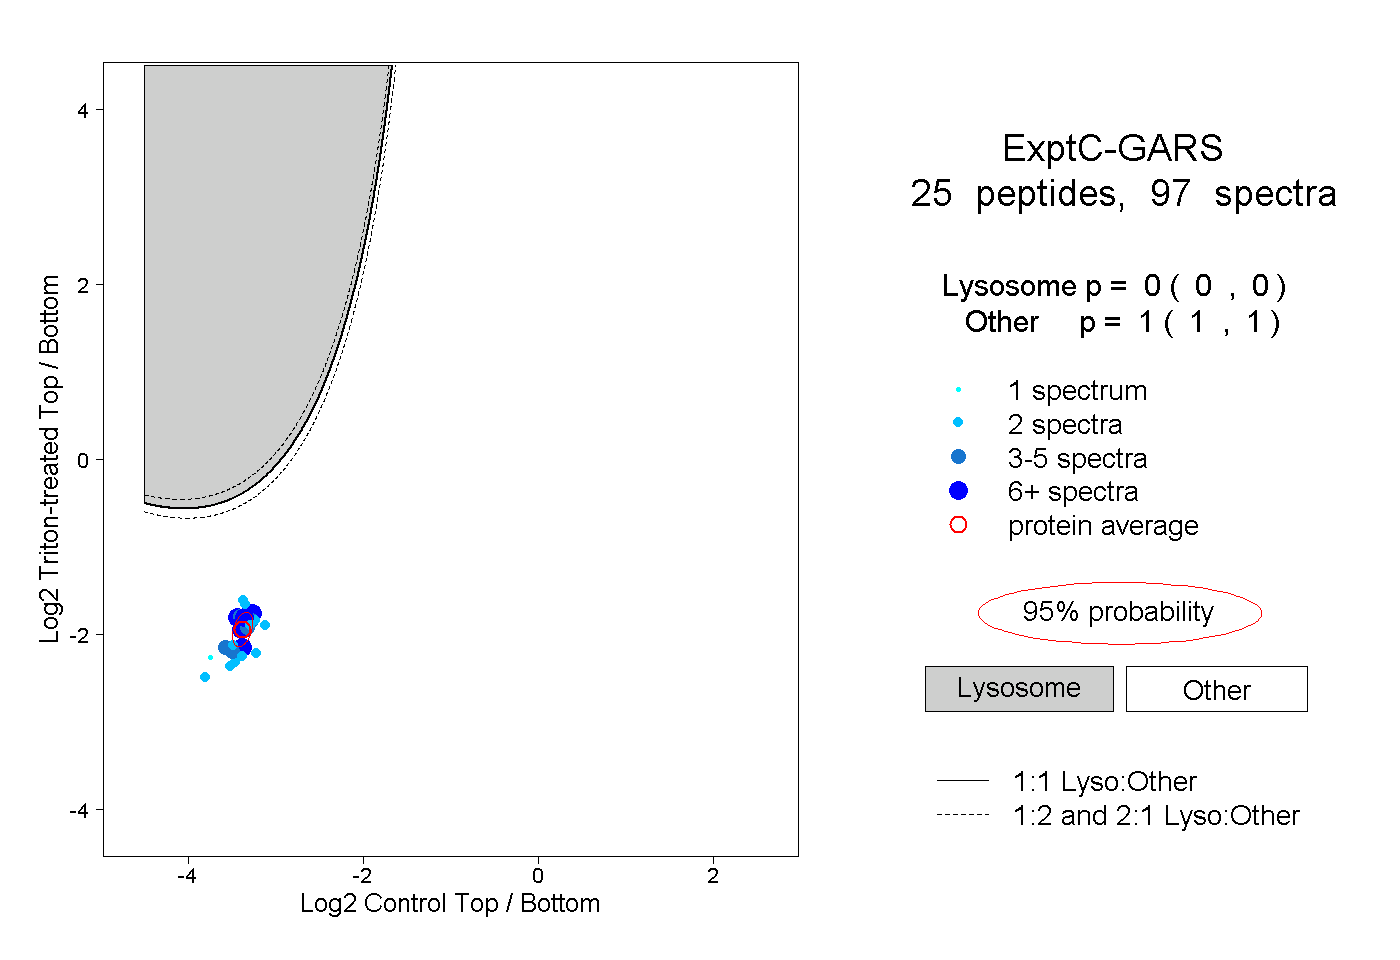
0.000 | 0.000
1.000 | 1.000
7peptides
spectra
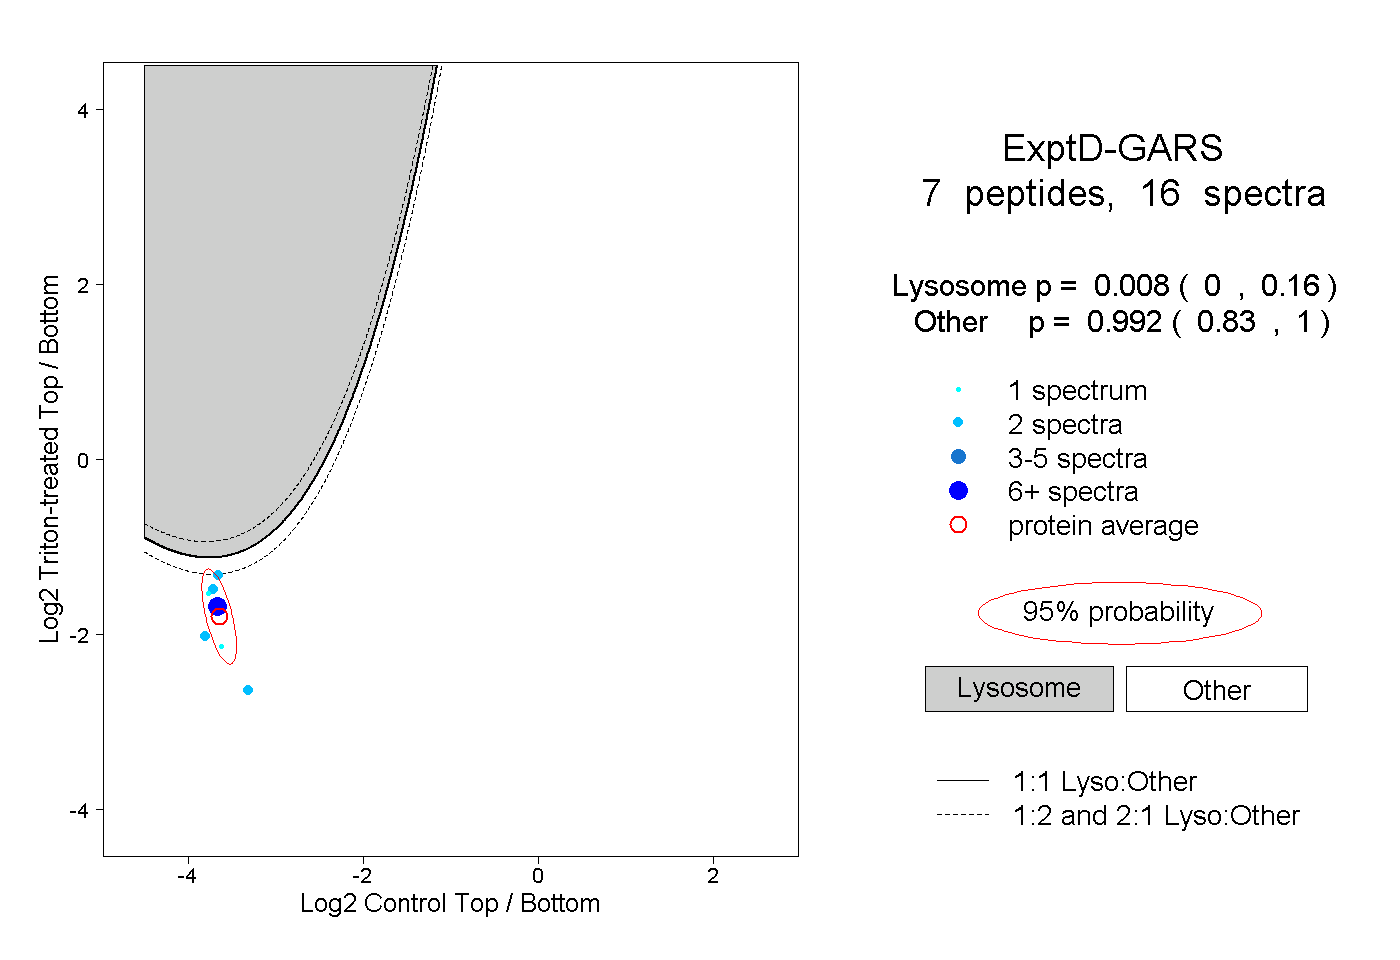
0.000 | 0.160
0.830 | 1.000