 2
2peptides
spectra
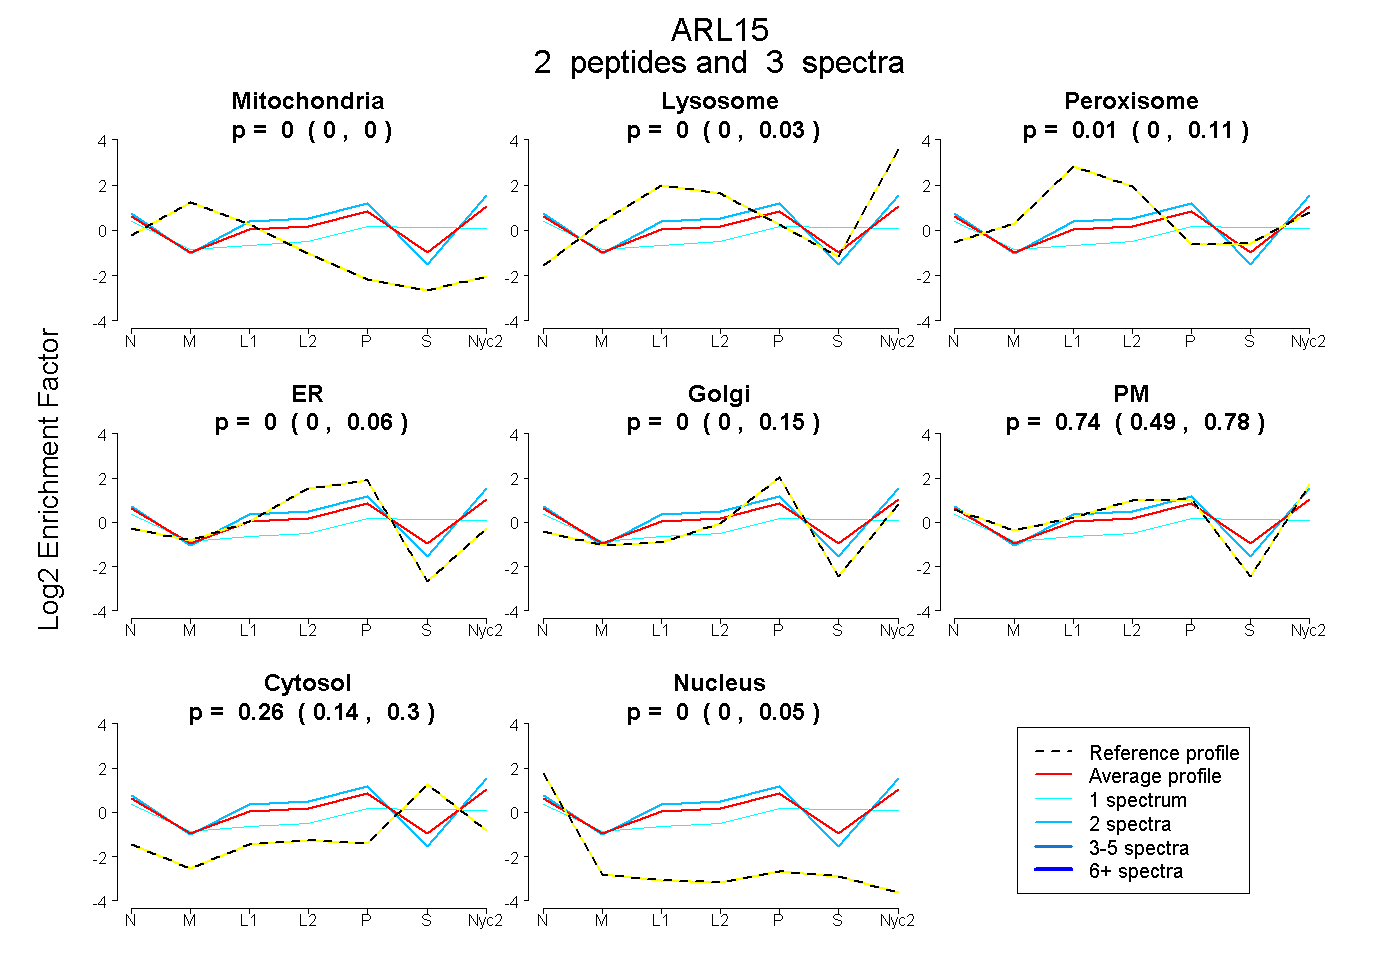
0.000 | 0.000
0.000 | 0.034
0.000 | 0.113
0.000 | 0.061
0.000 | 0.153
0.489 | 0.778
0.141 | 0.305
0.000 | 0.046
3peptides
spectra
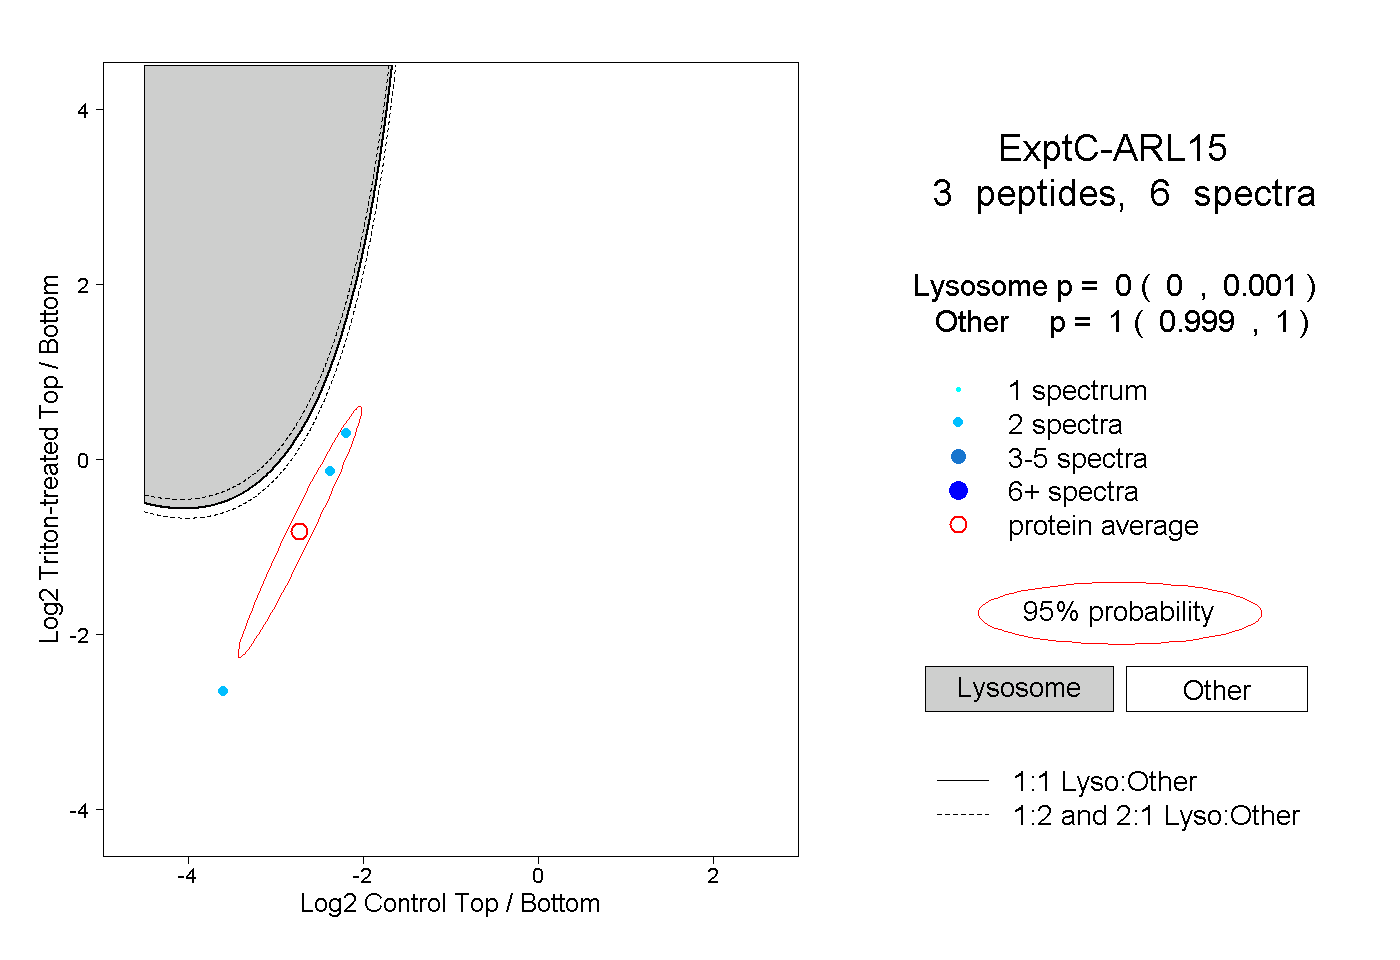
0.000 | 0.001
0.999 | 1.000
| Plot | Mito | Lyso | Perox | ER | Golgi | PM | Cytosol | Nucleus | |||||
| Expt A |
2 peptides |
3 spectra |
|
0.000 0.000 | 0.000 |
0.000 0.000 | 0.034 |
0.006 0.000 | 0.113 |
0.000 0.000 | 0.061 |
0.000 0.000 | 0.153 |
0.738 0.489 | 0.778 |
0.256 0.141 | 0.305 |
0.000 0.000 | 0.046 |
||
| Plot | Lyso | Other | |||||||||||
| Expt C |
3 peptides |
6 spectra |
|
0.000 0.000 | 0.001 |
1.000 0.999 | 1.000 |