 6
6peptides
spectra
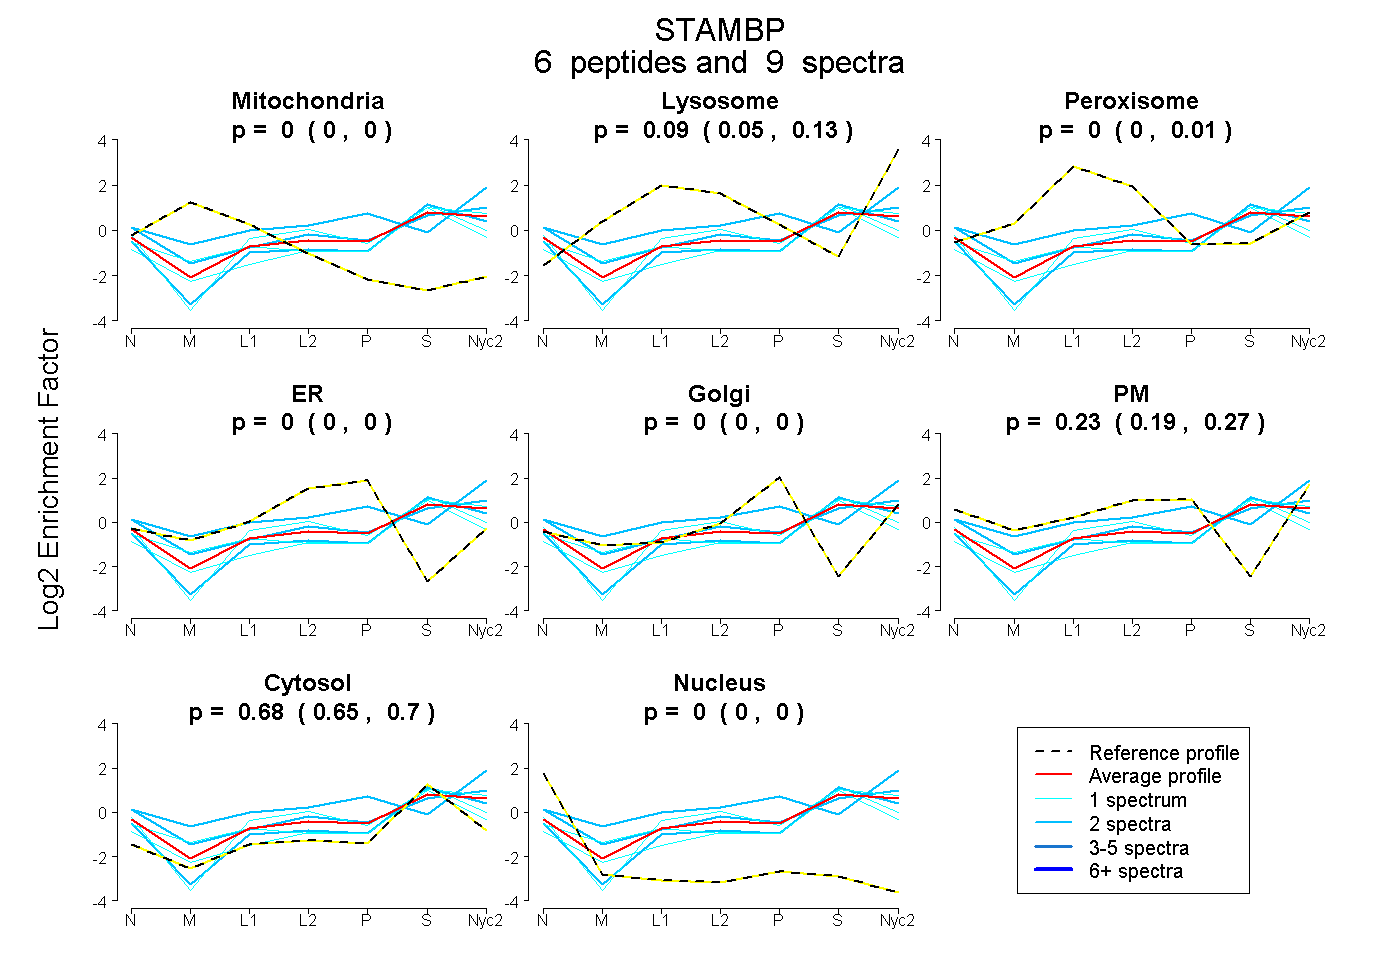
0.000 | 0.000
0.045 | 0.130
0.000 | 0.009
0.000 | 0.000
0.000 | 0.000
0.189 | 0.270
0.648 | 0.697
0.000 | 0.000
1peptide
spectrum
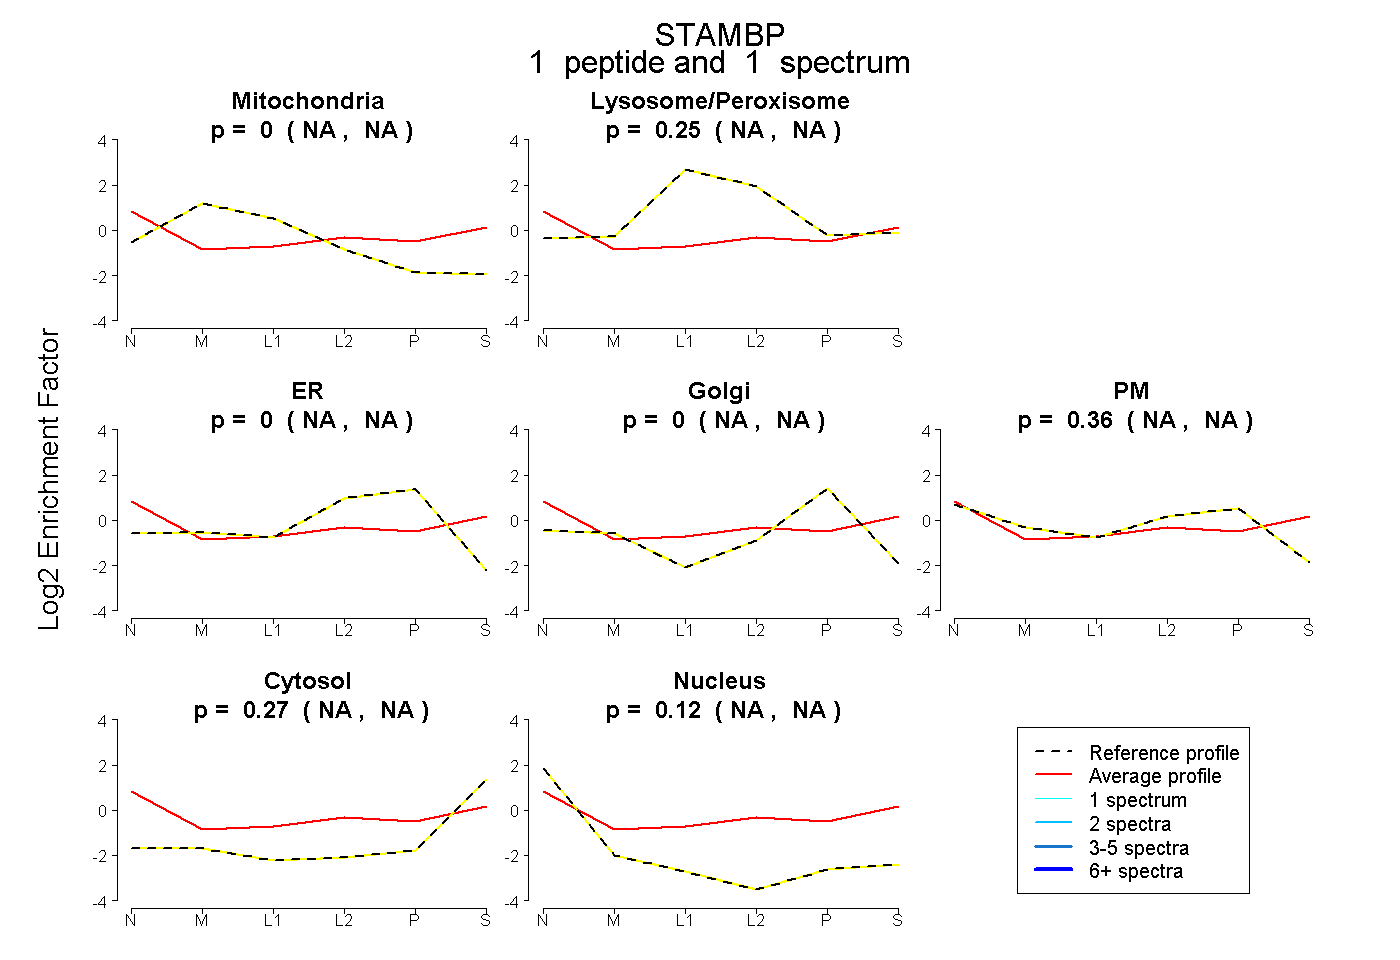
NA | NA
NA | NA
NA | NA
NA | NA
NA | NA
NA | NA
NA | NA
6peptides
spectra
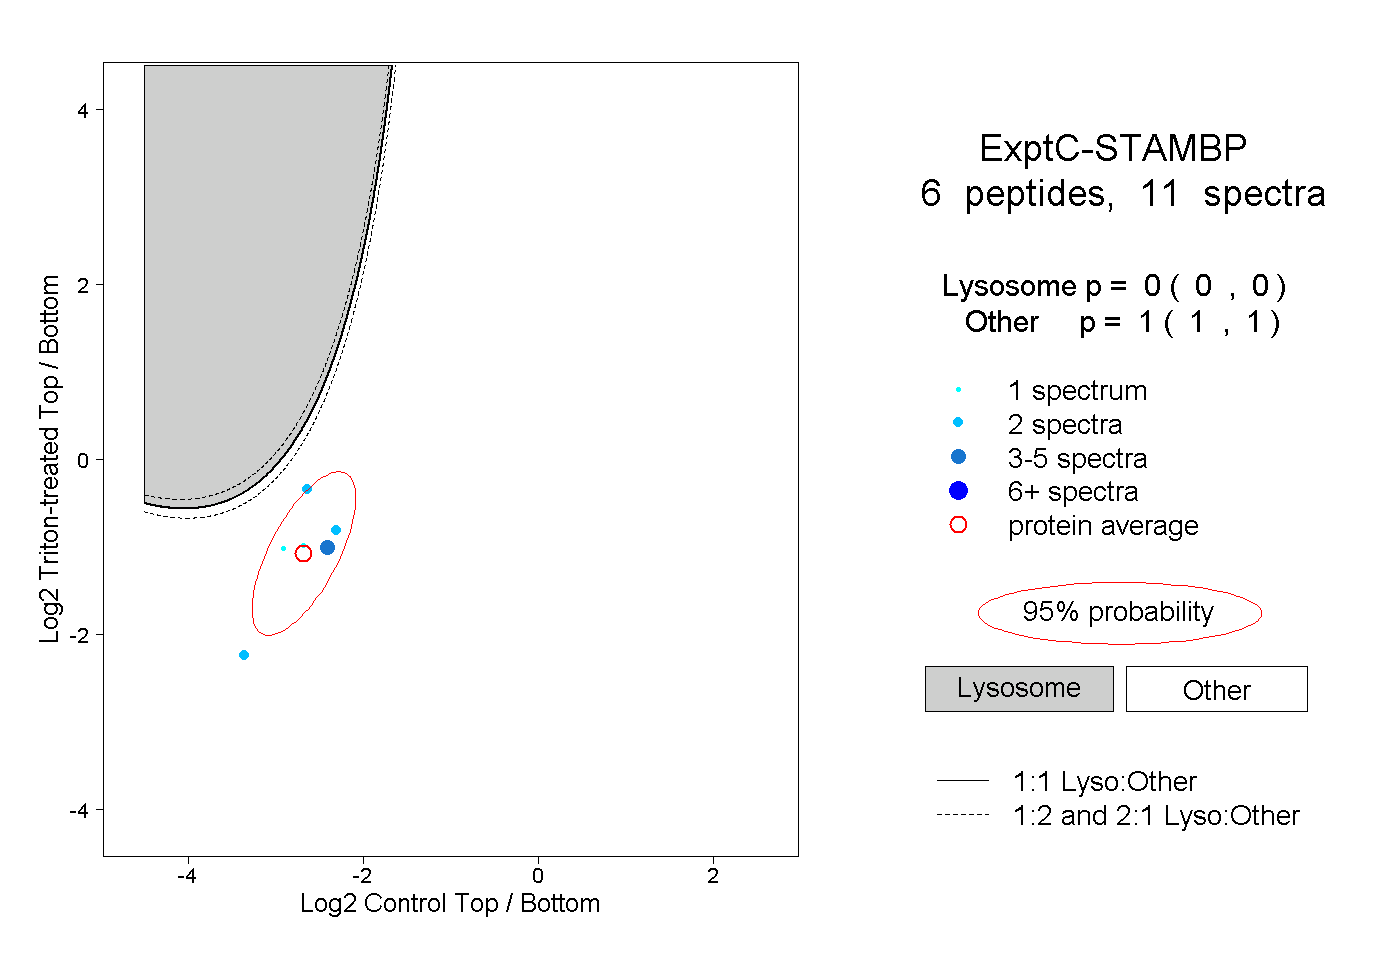
0.000 | 0.000
1.000 | 1.000