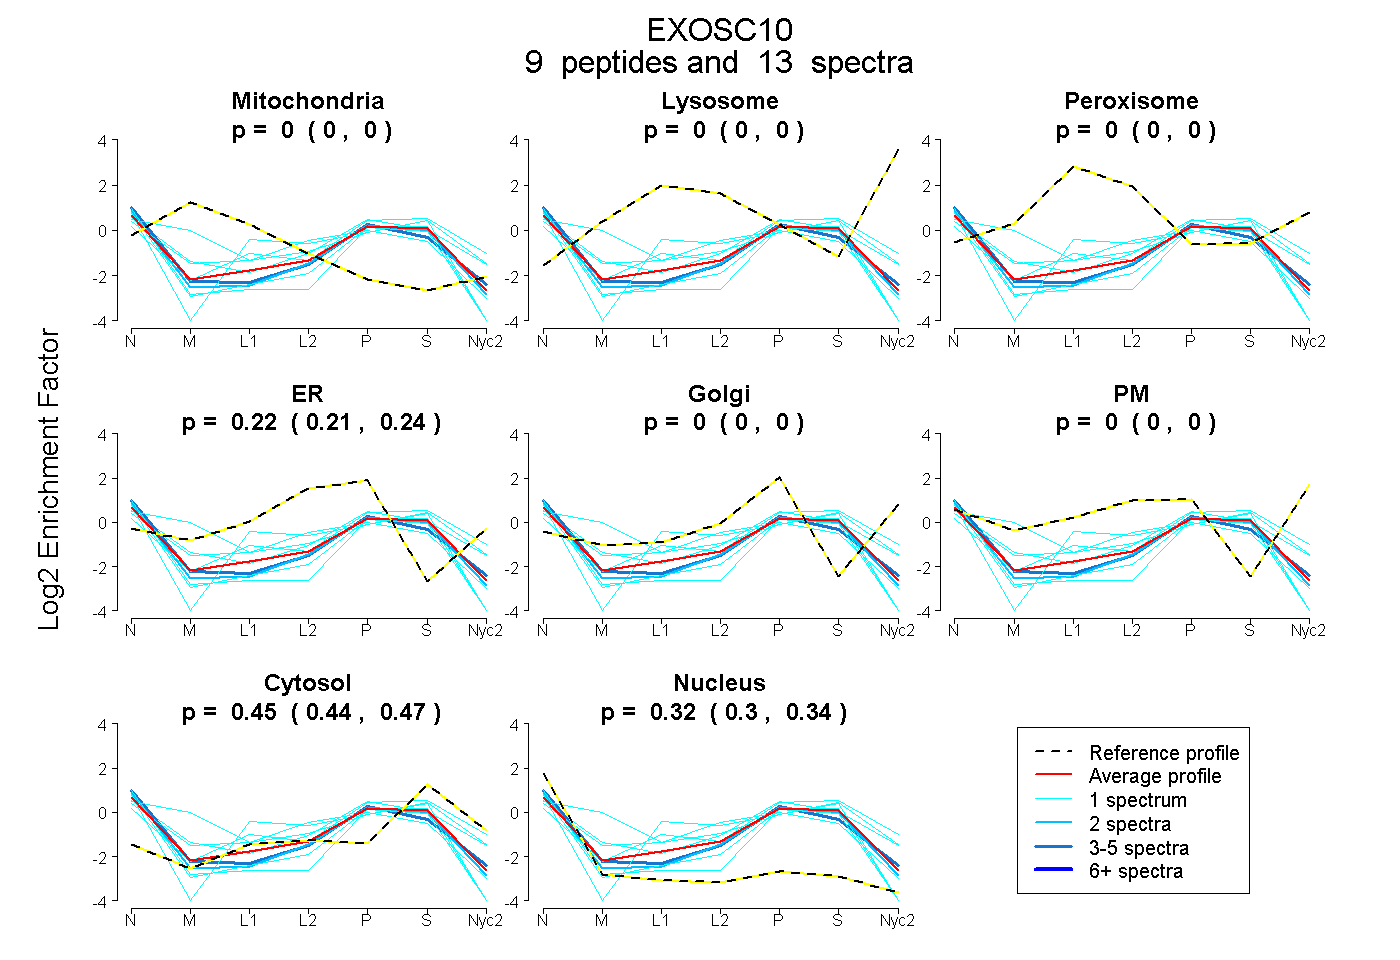
EXOSC10
[ENSRNOP00000014629]

Main page
Plot Mito Lyso Perox ER Golgi PM Cytosol Nucleus
Expt A 9
peptides
13
spectra
0.000
0.000 | 0.000
0.000
0.000 | 0.000

0.000
0.000 | 0.000
0.225
0.210 | 0.238
0.000
0.000 | 0.000
0.000
0.000 | 0.000
0.452
0.435 | 0.466
0.323
0.305 | 0.338

Plot Mito Lyso or Perox ER Golgi PM Cytosol Nucleus
Expt B 4
peptides
5
spectra
0.000
0.000 | 0.000

0.000
0.000 | 0.000

0.000
0.000 | 0.000
0.175
0.000 | 0.286
0.075
0.000 | 0.218
0.510
0.407 | 0.598
0.239
0.138 | 0.319

1 spectrum, VGILLDEASGVNK 0.000 0.035 0.000 0.000 0.539 0.320 0.105
1 spectrum, NILRPQLR 0.000 0.000 0.000 0.218 0.000 0.331 0.451
2 spectra, LLNLAR 0.000 0.000 0.000 0.298 0.038 0.270 0.393
1 spectrum, LLQVAR 0.000 0.000 0.000 0.000 0.000 1.000 0.000
Plot Lyso Other
Expt C 1
peptide
1
spectrum

0.000
NA | NA


1.000
NA | NA

Calculate protein distances from select experiments.
Maximum number of results     Minimum number of peptides     Minimum number of spectra    
Expt A     Expt B     Expt C