 2
2peptides
spectra
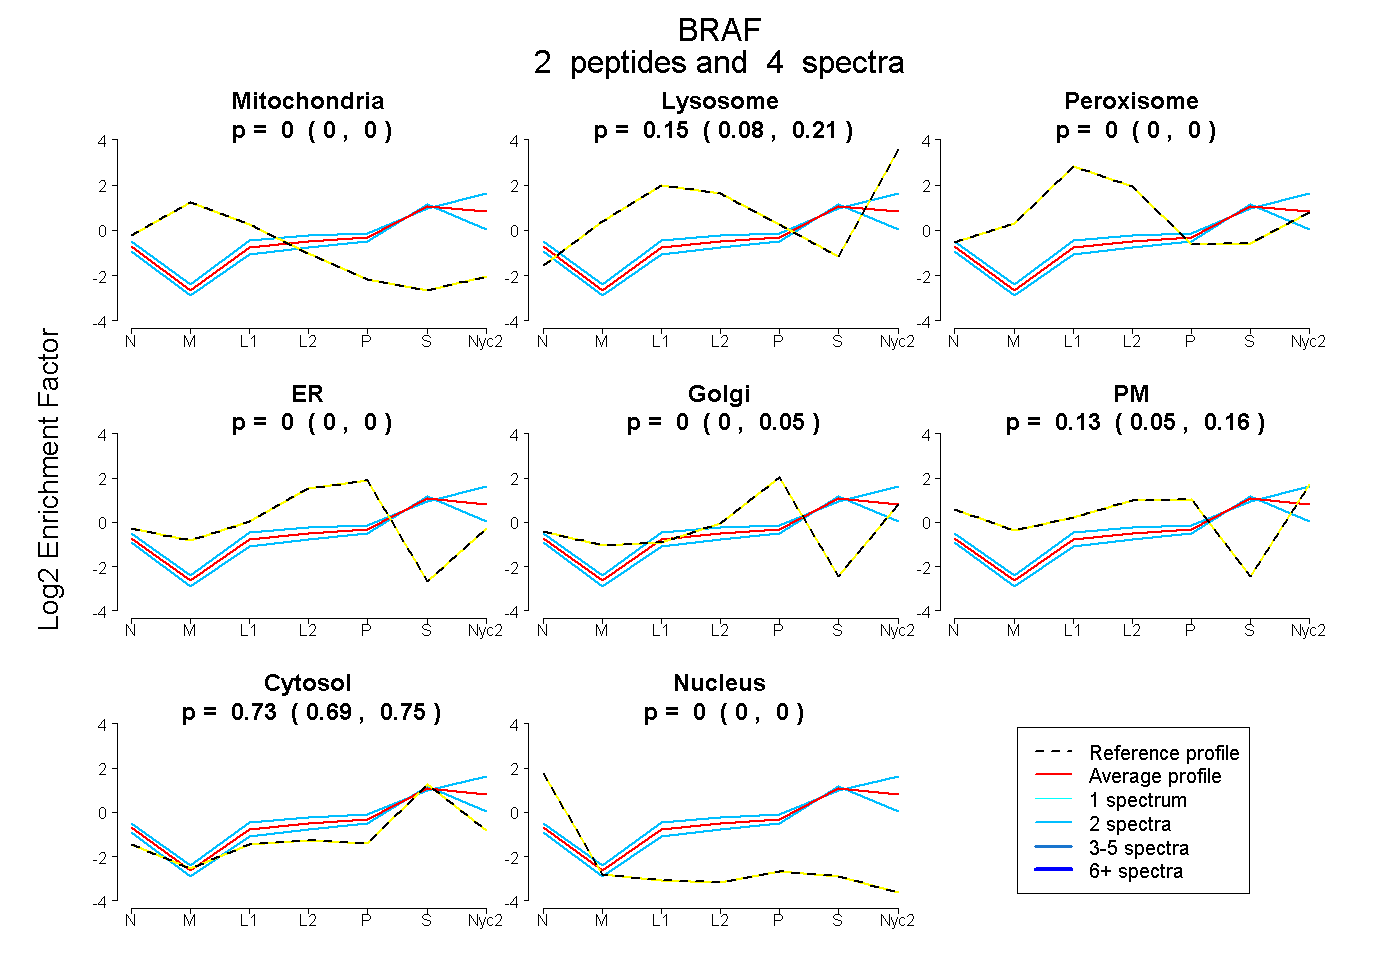
0.000 | 0.000
0.082 | 0.205
0.000 | 0.000
0.000 | 0.000
0.000 | 0.049
0.048 | 0.160
0.691 | 0.753
0.000 | 0.000
2peptides
spectra
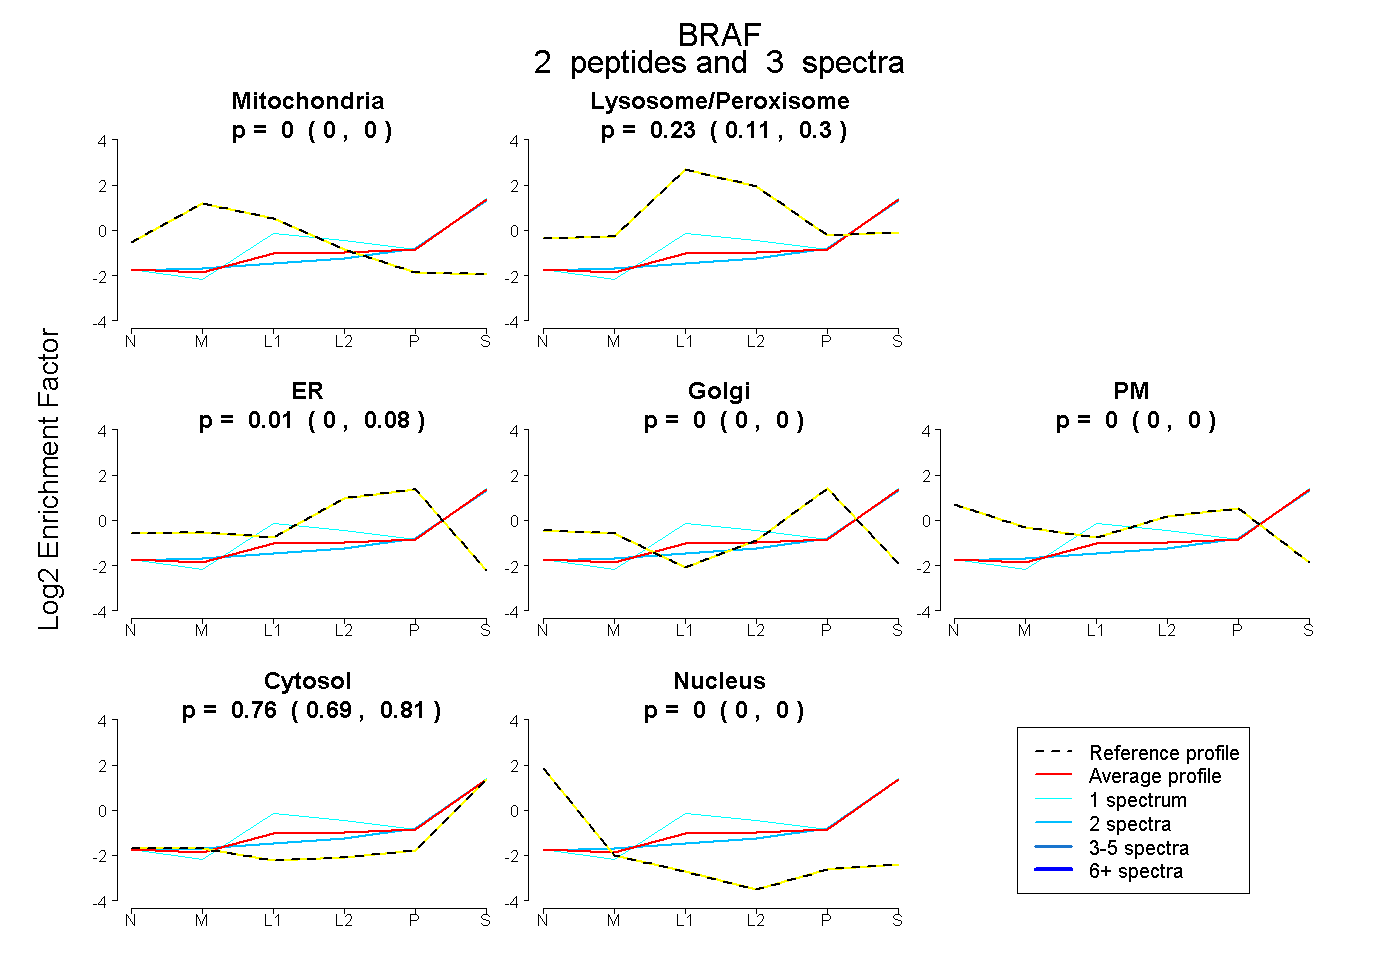
0.000 | 0.000
0.108 | 0.298
0.000 | 0.080
0.000 | 0.000
0.000 | 0.000
0.692 | 0.806
0.000 | 0.000
2peptides
spectra
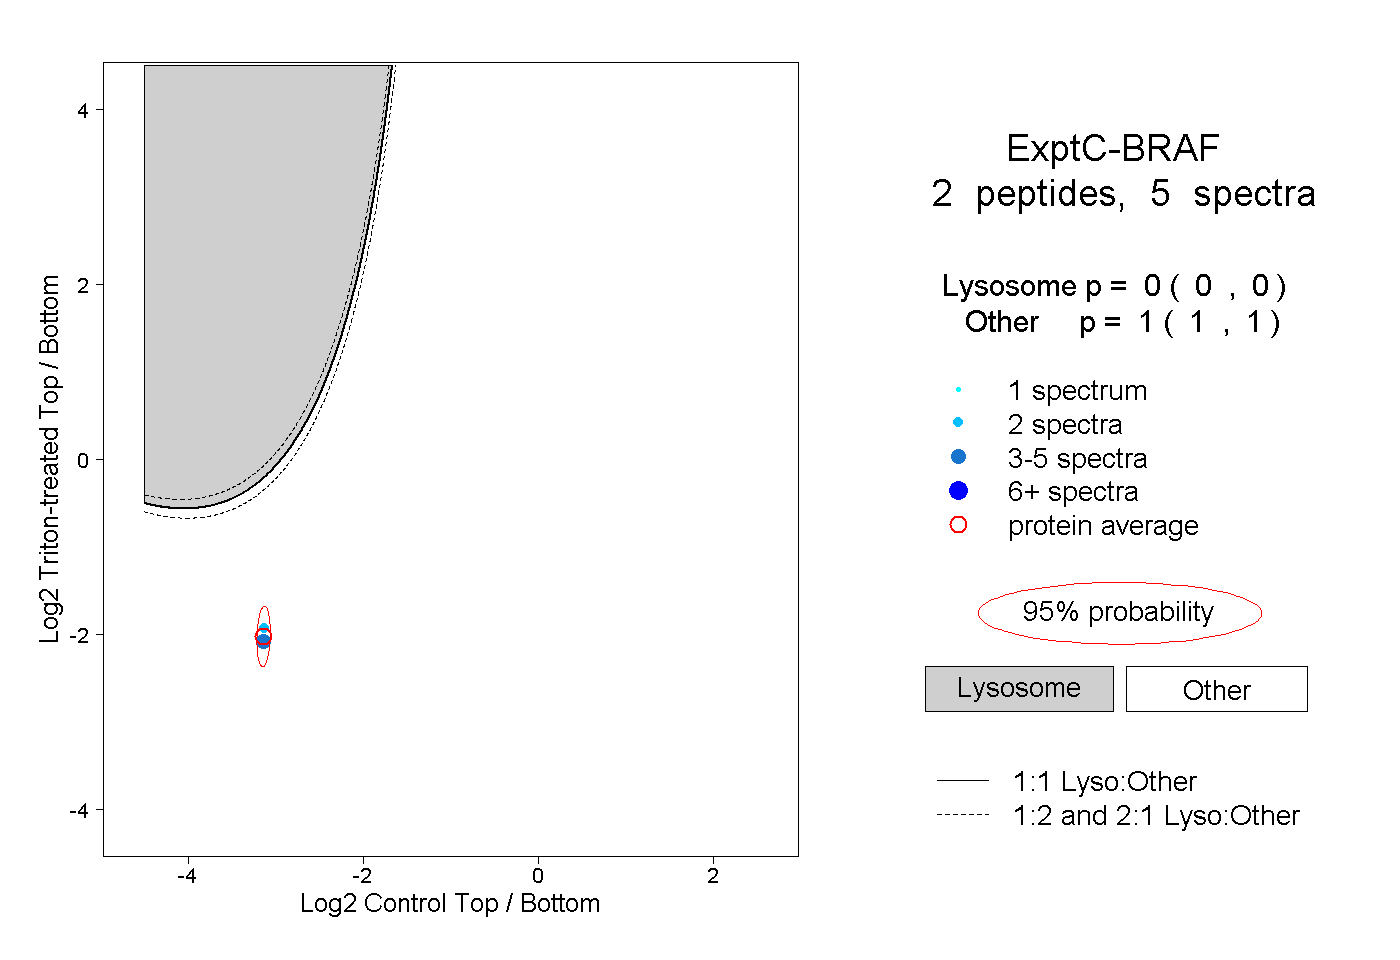
0.000 | 0.000
1.000 | 1.000