 7
7peptides
spectra
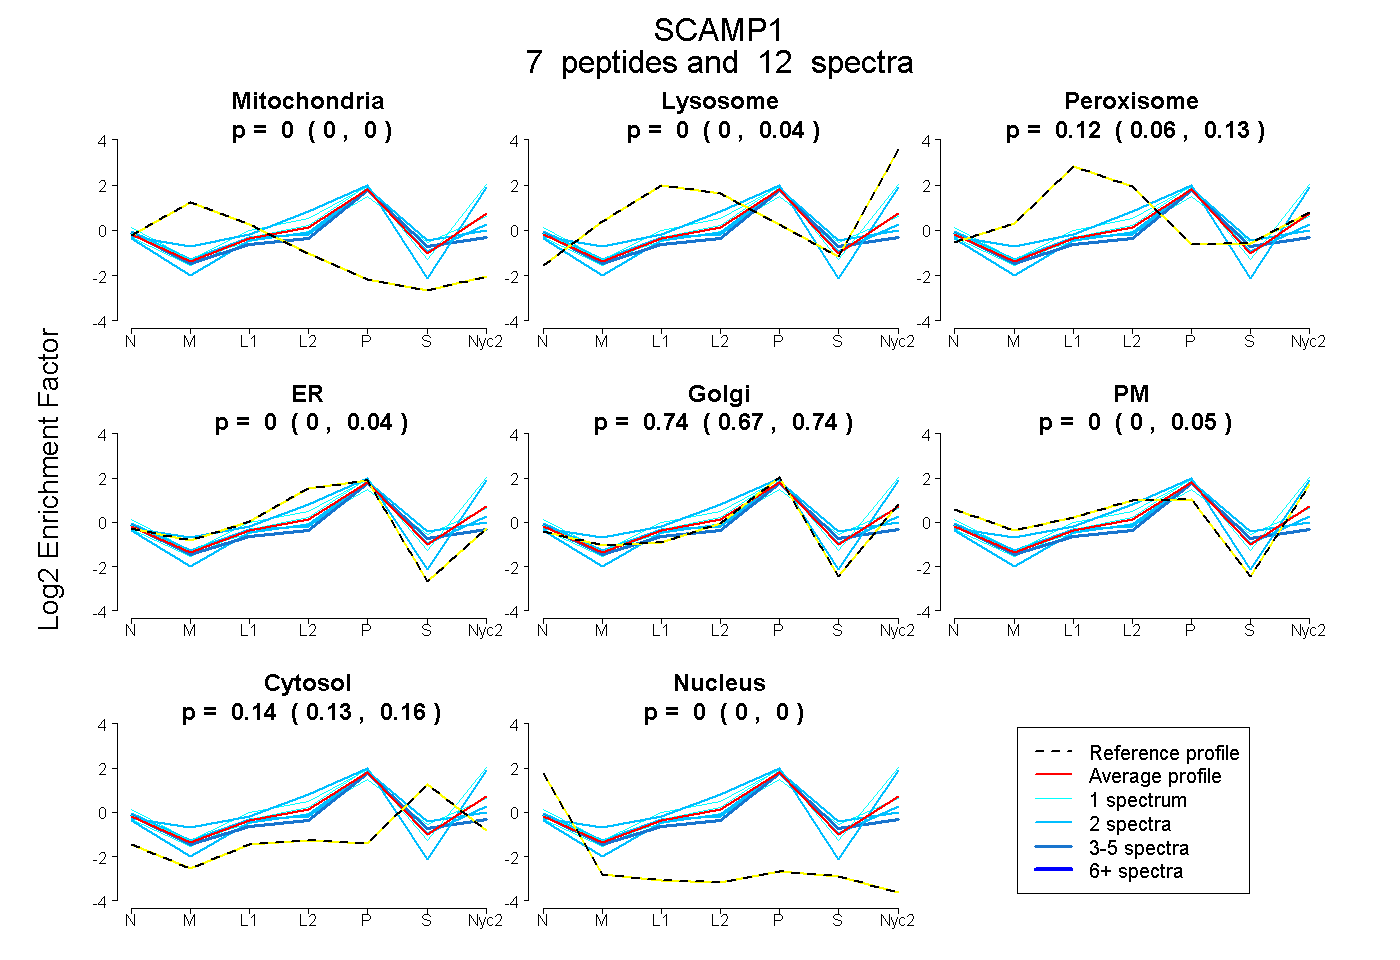
0.000 | 0.000
0.000 | 0.041
0.063 | 0.130
0.000 | 0.042
0.668 | 0.744
0.000 | 0.053
0.128 | 0.160
0.000 | 0.000
| Plot | Mito | Lyso | Perox | ER | Golgi | PM | Cytosol | Nucleus | |||||
| Expt A |
7 peptides |
12 spectra |
|
0.000 0.000 | 0.000 |
0.000 0.000 | 0.041 |
0.123 0.063 | 0.130 |
0.000 0.000 | 0.042 |
0.736 0.668 | 0.744 |
0.001 0.000 | 0.053 |
0.141 0.128 | 0.160 |
0.000 0.000 | 0.000 |
| 3 spectra, TPPPGGVK | 0.000 | 0.000 | 0.000 | 0.218 | 0.478 | 0.000 | 0.305 | 0.000 | ||
| 1 spectrum, EHALAQAELLK | 0.000 | 0.046 | 0.047 | 0.099 | 0.654 | 0.000 | 0.154 | 0.000 | ||
| 2 spectra, VHGLYR | 0.000 | 0.189 | 0.000 | 0.000 | 0.562 | 0.248 | 0.000 | 0.000 | ||
| 1 spectrum, TTGASFEK | 0.000 | 0.246 | 0.000 | 0.000 | 0.578 | 0.133 | 0.043 | 0.000 | ||
| 1 spectrum, AQQEFATGVMSNK | 0.000 | 0.000 | 0.041 | 0.000 | 0.450 | 0.243 | 0.267 | 0.000 | ||
| 2 spectra, NVPPGLDEYNPFSDSR | 0.000 | 0.000 | 0.000 | 0.230 | 0.441 | 0.000 | 0.329 | 0.000 | ||
| 2 spectra, DPSVTQVTR | 0.000 | 0.000 | 0.094 | 0.050 | 0.668 | 0.000 | 0.188 | 0.000 |
| Plot | Lyso | Other | |||||||||||
| Expt C |
6 peptides |
17 spectra |
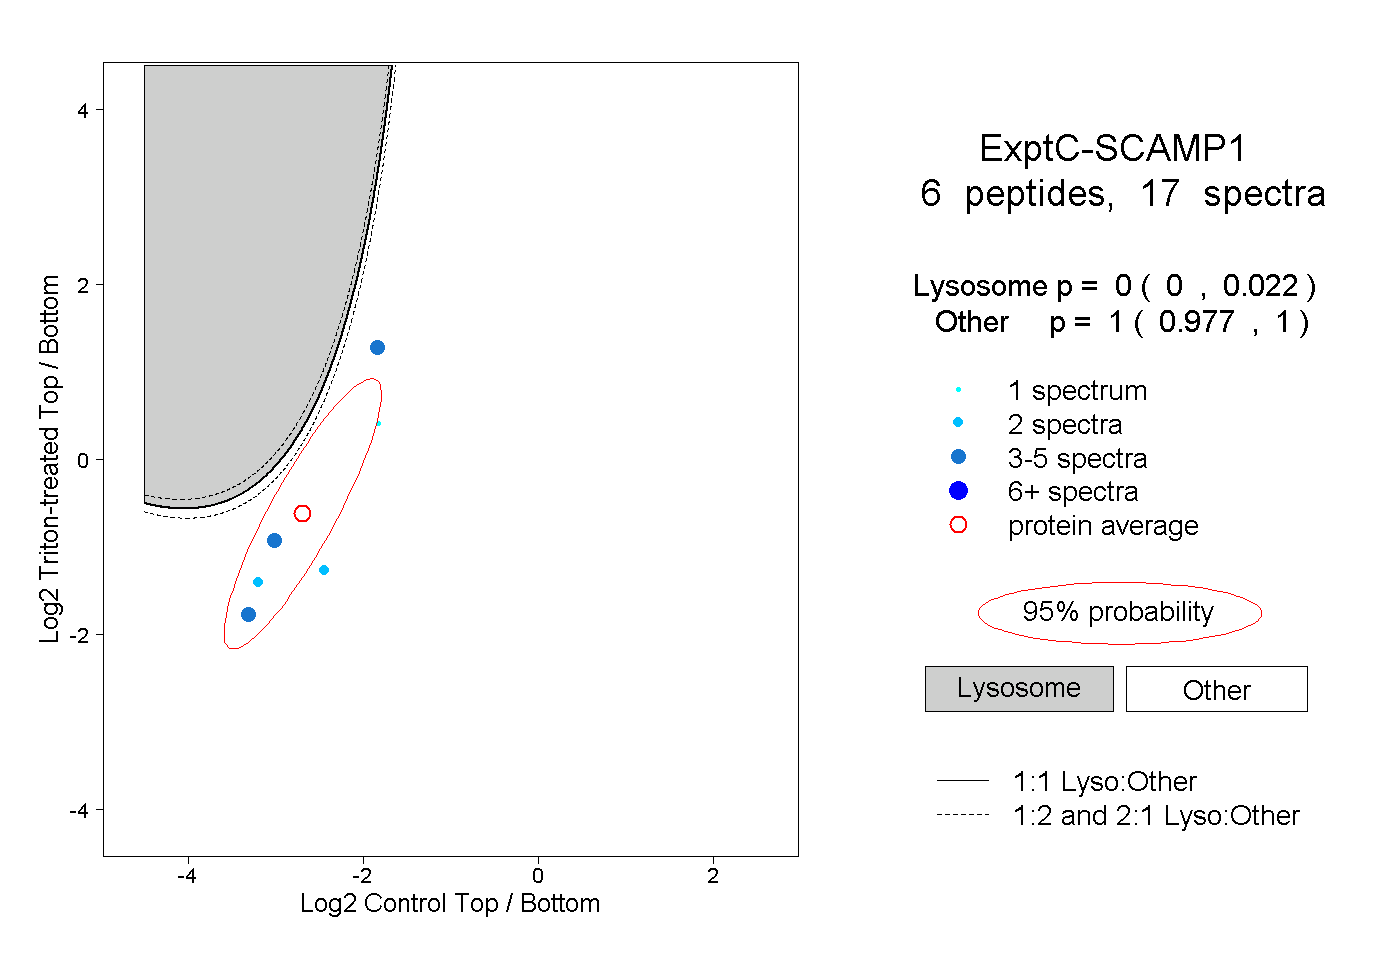 |
0.000 0.000 | 0.022 |
1.000 0.977 | 1.000 |