 7
7peptides
spectra
0.000 | 0.000
0.000 | 0.041
0.063 | 0.130
0.000 | 0.042
0.668 | 0.744
0.000 | 0.053
0.128 | 0.160
0.000 | 0.000
6peptides
spectra
0.000 | 0.022
0.977 | 1.000
| Plot | Mito | Lyso | Perox | ER | Golgi | PM | Cytosol | Nucleus | |||||
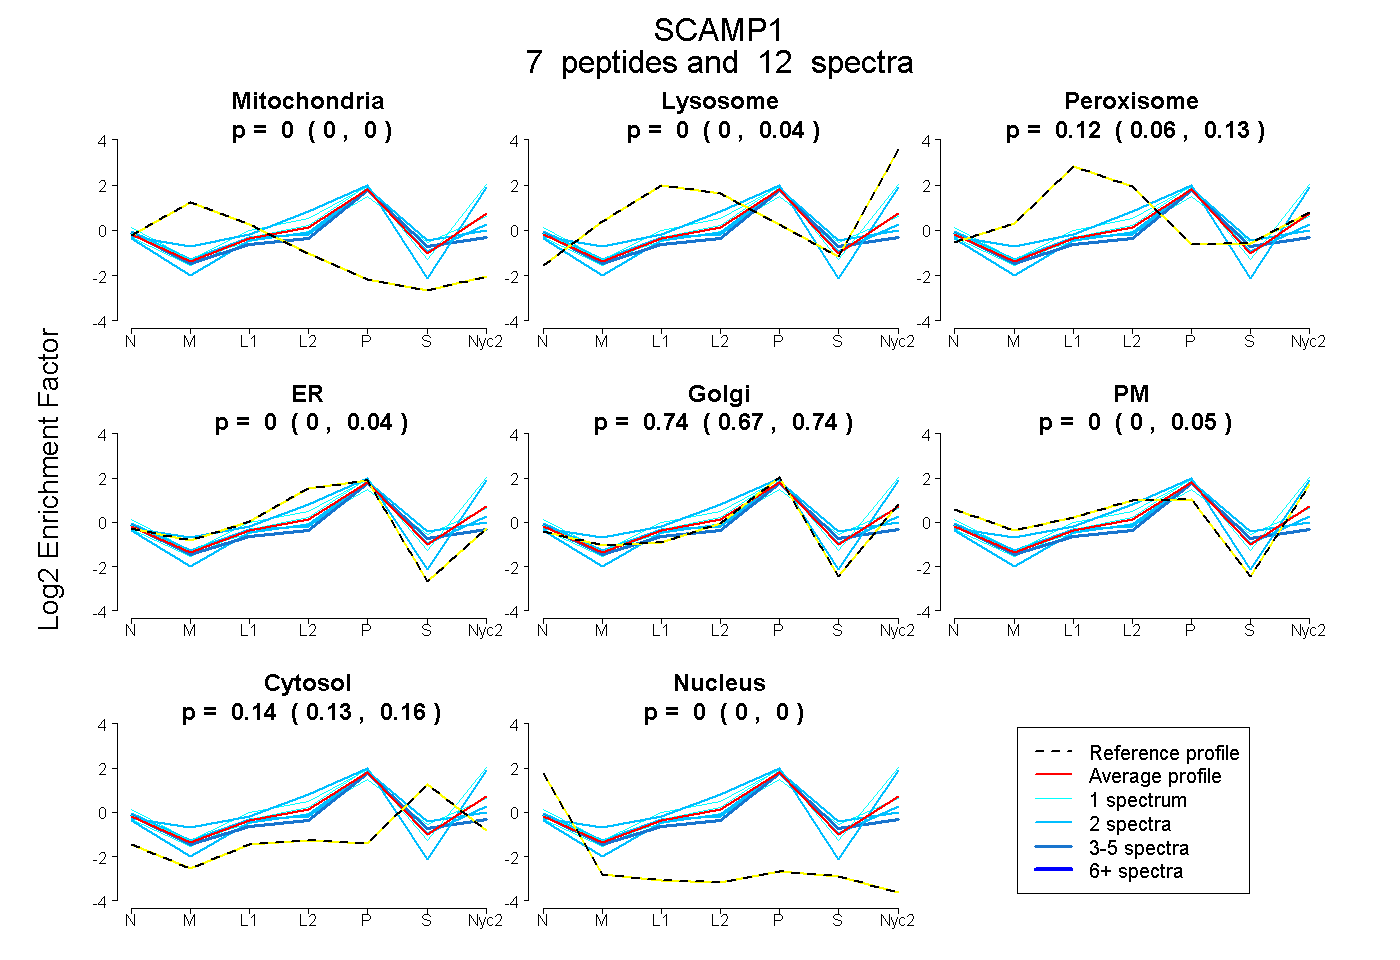
| Expt A |
7 peptides |
12 spectra |
|
0.000 0.000 | 0.000 |
0.000 0.000 | 0.041 |
0.123 0.063 | 0.130 |
0.000 0.000 | 0.042 |
0.736 0.668 | 0.744 |
0.001 0.000 | 0.053 |
0.141 0.128 | 0.160 |
0.000 0.000 | 0.000 |
||
| Plot | Lyso | Other | |||||||||||
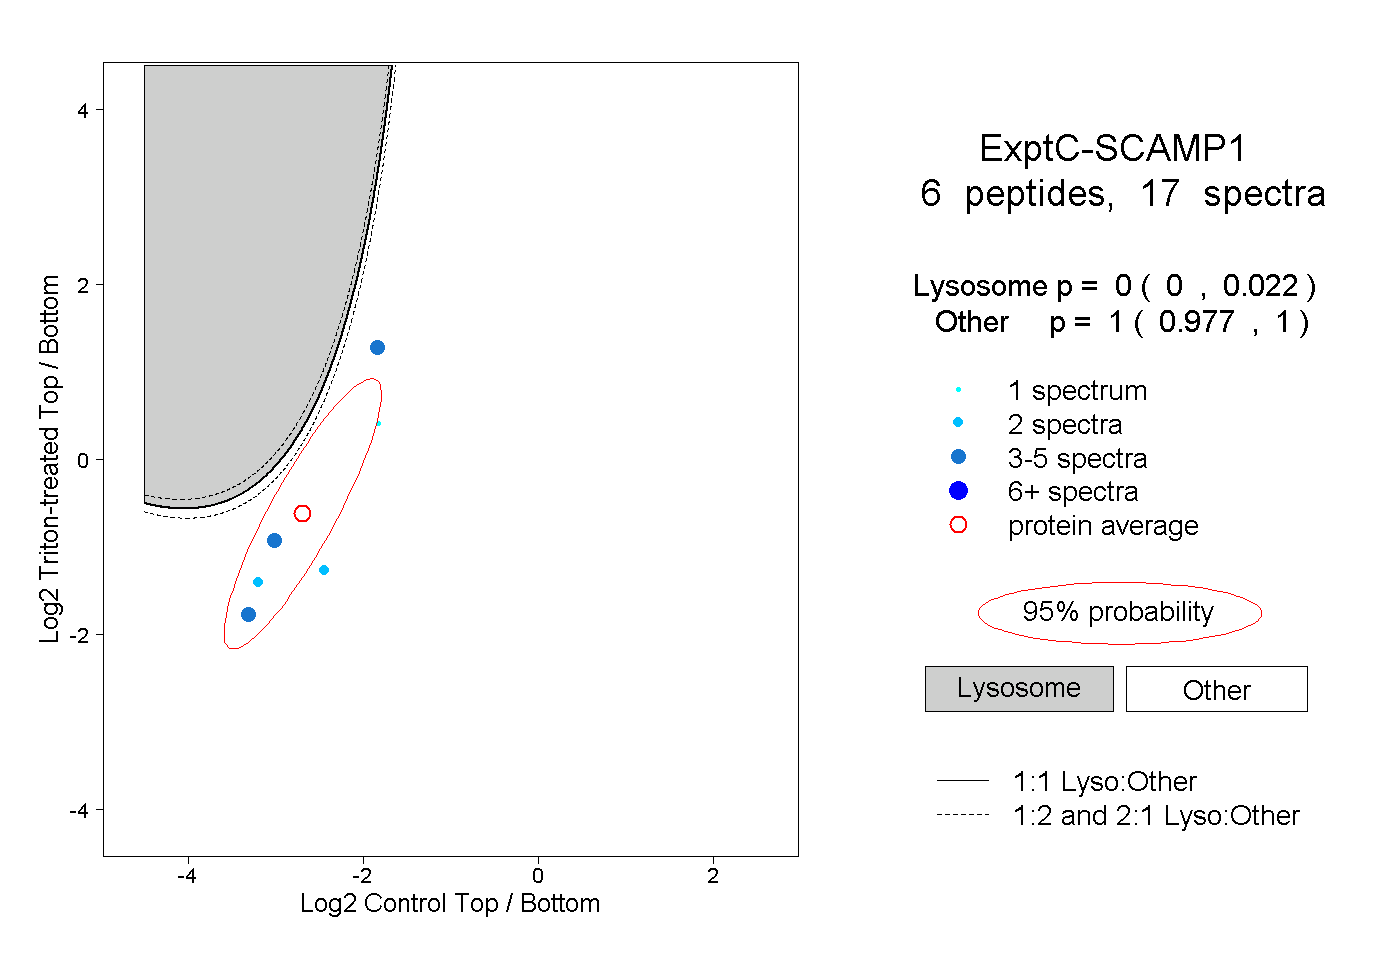
| Expt C |
6 peptides |
17 spectra |
|
0.000 0.000 | 0.022 |
1.000 0.977 | 1.000 |