 8
8peptides
spectra
0.000 | 0.000
1.000 | 1.000
0.000 | 0.000
0.000 | 0.000
0.000 | 0.000
0.000 | 0.000
0.000 | 0.000
0.000 | 0.000
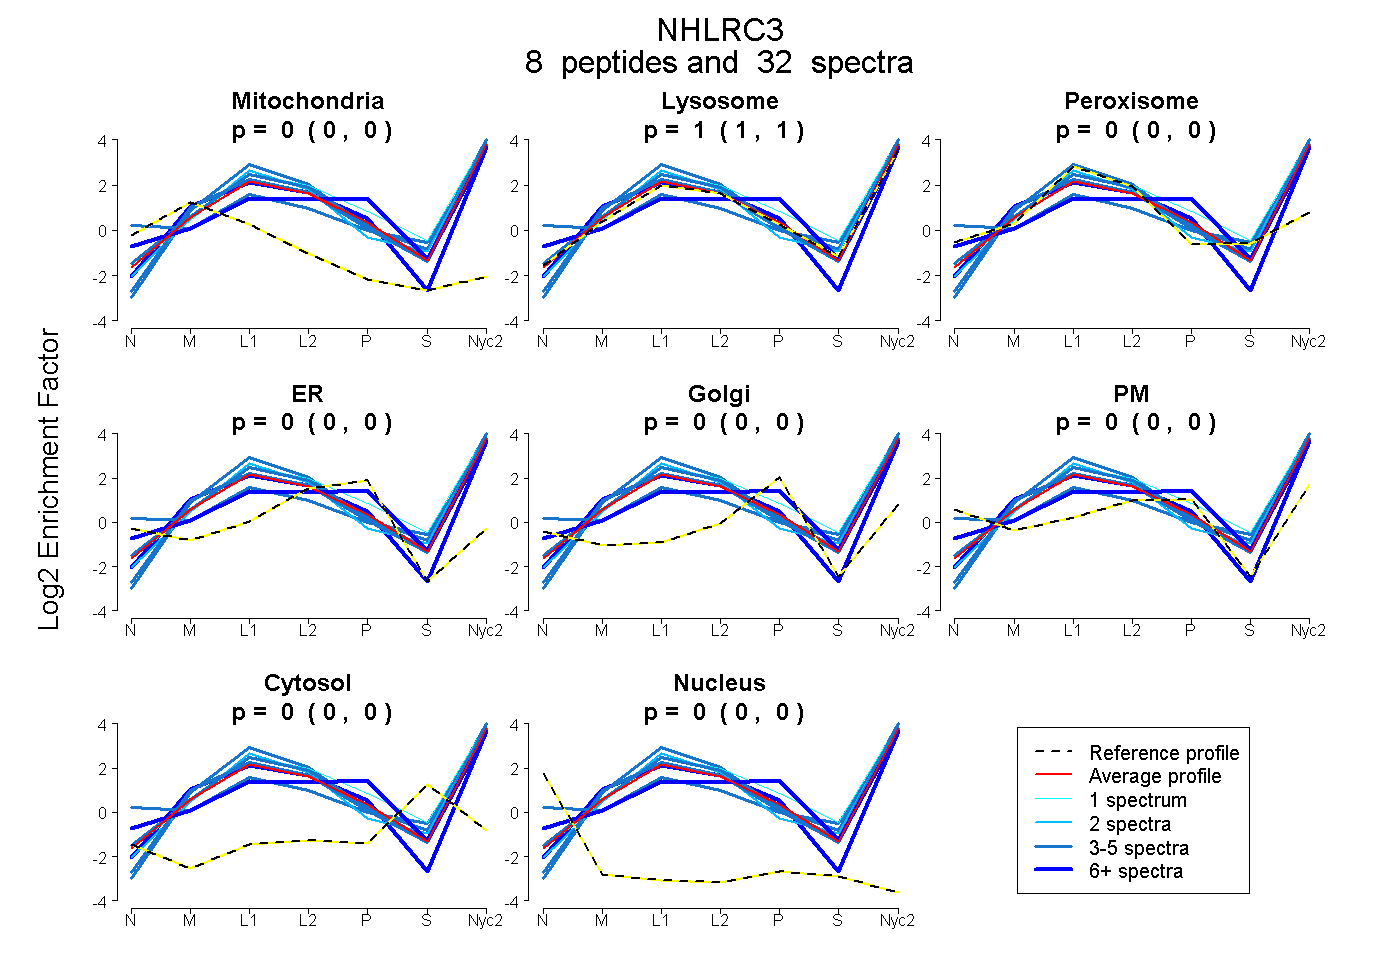
| Plot | Mito | Lyso | Perox | ER | Golgi | PM | Cytosol | Nucleus | |||||
| Expt A |
8 peptides |
32 spectra |
|
0.000 0.000 | 0.000 |
1.000 1.000 | 1.000 |
0.000 0.000 | 0.000 |
0.000 0.000 | 0.000 |
0.000 0.000 | 0.000 |
0.000 0.000 | 0.000 |
0.000 0.000 | 0.000 |
0.000 0.000 | 0.000 |
| 1 spectrum, LQVFDK | 0.000 | 1.000 | 0.000 | 0.000 | 0.000 | 0.000 | 0.000 | 0.000 | ||
| 5 spectra, VWVADR | 0.000 | 1.000 | 0.000 | 0.000 | 0.000 | 0.000 | 0.000 | 0.000 | ||
| 4 spectra, FTPDGR | 0.000 | 0.729 | 0.006 | 0.000 | 0.000 | 0.217 | 0.048 | 0.000 | ||
| 6 spectra, YVPWHSR | 0.000 | 0.740 | 0.000 | 0.000 | 0.081 | 0.178 | 0.000 | 0.000 | ||
| 2 spectra, LSQDFMILWLR | 0.000 | 1.000 | 0.000 | 0.000 | 0.000 | 0.000 | 0.000 | 0.000 | ||
| 6 spectra, FNIPHSVTLDSVGR | 0.005 | 0.974 | 0.000 | 0.021 | 0.000 | 0.000 | 0.000 | 0.000 | ||
| 3 spectra, LDLGWPK | 0.000 | 1.000 | 0.000 | 0.000 | 0.000 | 0.000 | 0.000 | 0.000 | ||
| 5 spectra, VLVFSEDGYFLR | 0.000 | 1.000 | 0.000 | 0.000 | 0.000 | 0.000 | 0.000 | 0.000 |
| Plot | Mito | Lyso or Perox | ER | Golgi | PM | Cytosol | Nucleus | ||||||
| Expt B |
5 peptides |
8 spectra |
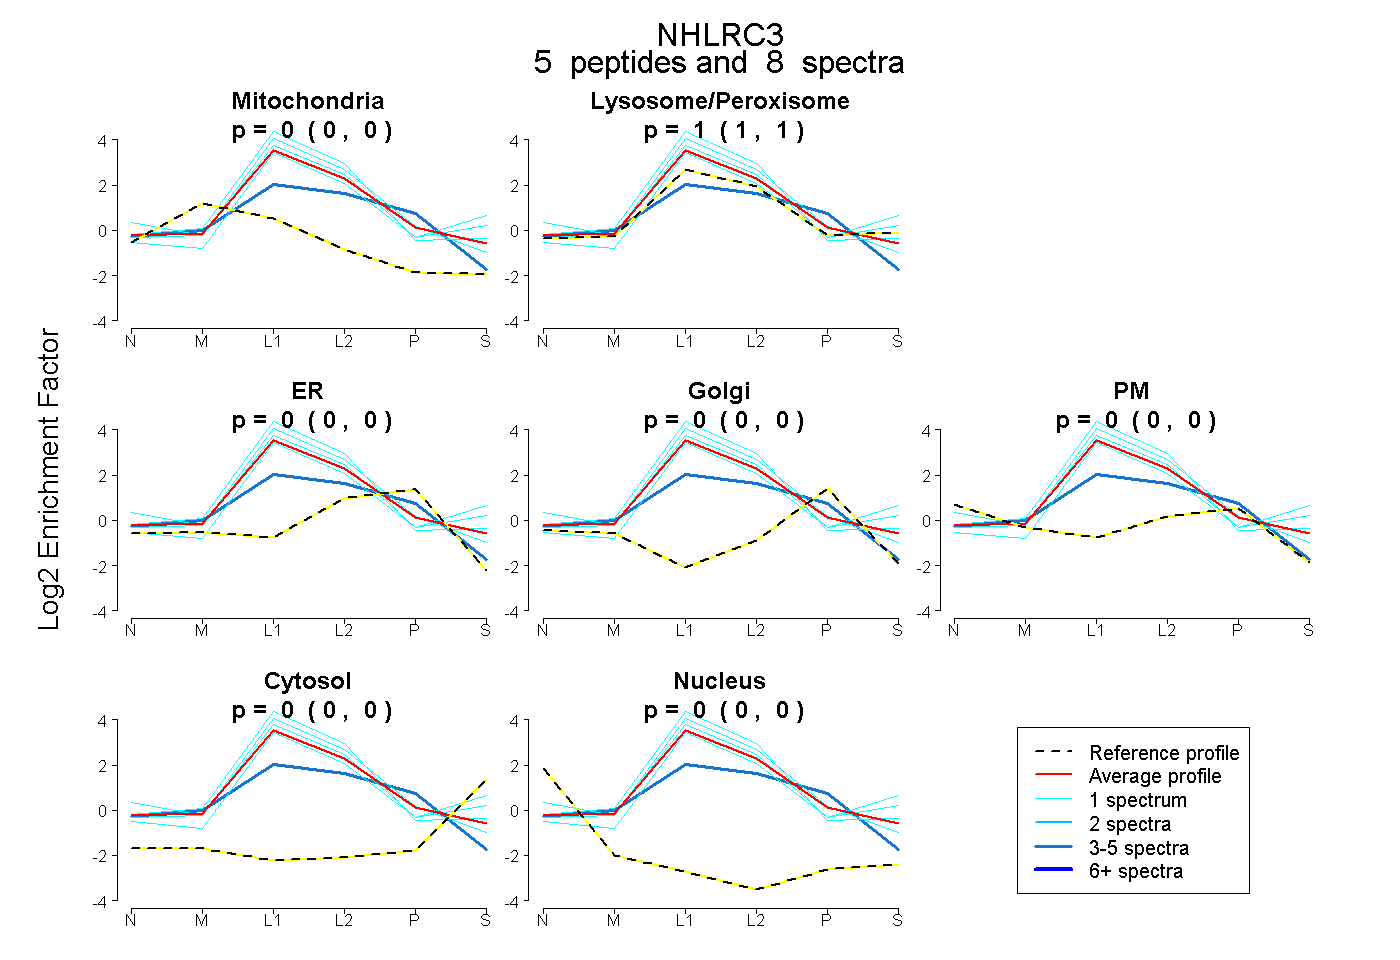 |
0.000 0.000 | 0.000 |
1.000 1.000 | 1.000 |
0.000 0.000 | 0.000 |
0.000 0.000 | 0.000 |
0.000 0.000 | 0.000 |
0.000 0.000 | 0.000 |
0.000 0.000 | 0.000 |
|||
| Plot | Lyso | Other | |||||||||||
| Expt C |
9 peptides |
46 spectra |
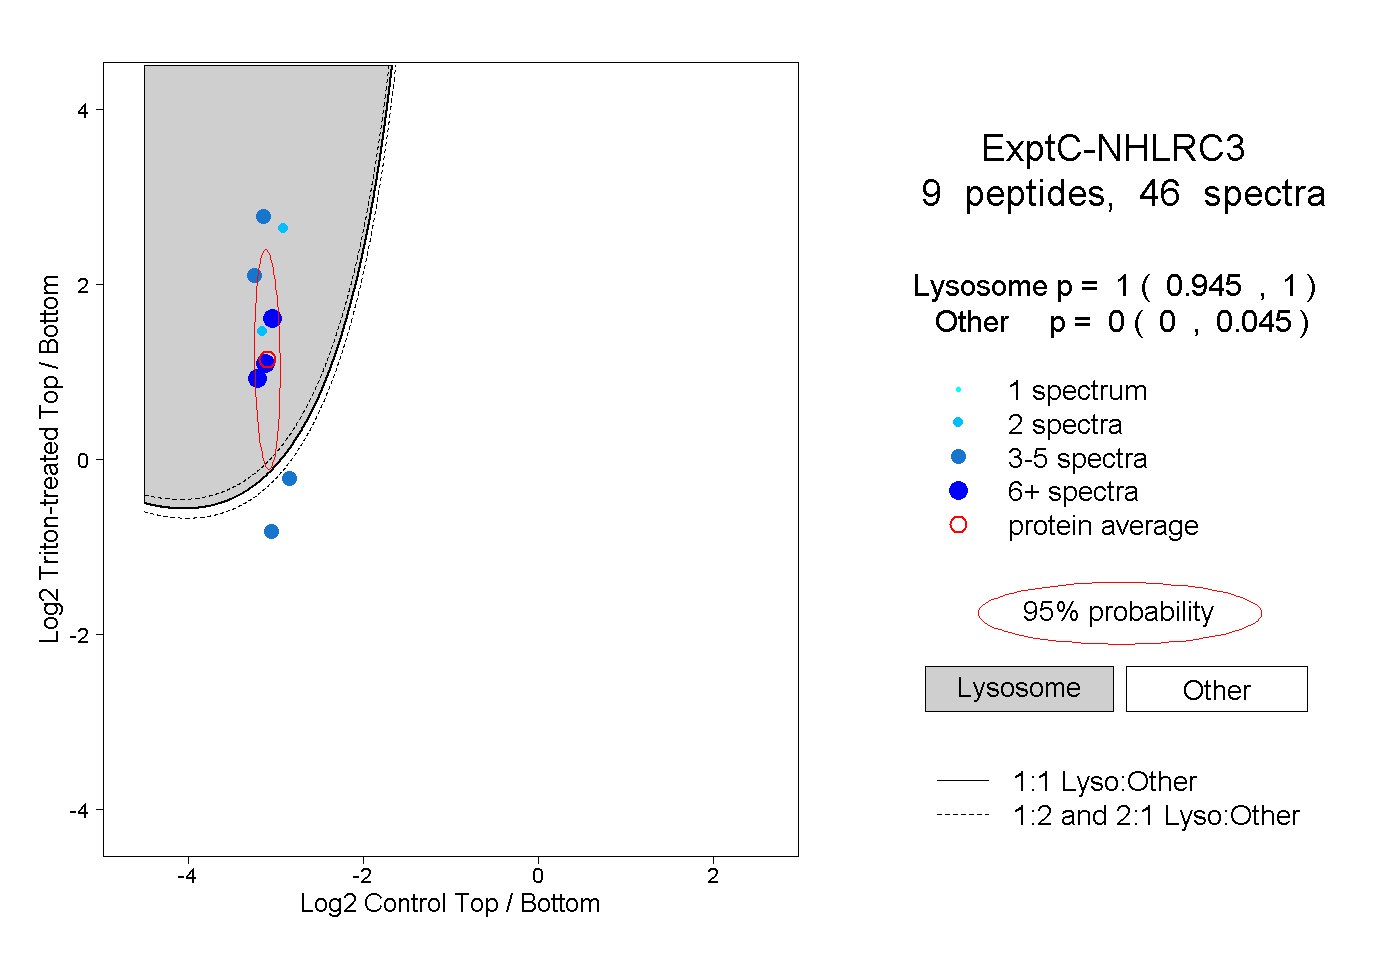 |
1.000 0.945 | 1.000 |
0.000 0.000 | 0.045 |
||||||||
| Plot | Lyso | Other | |||||||||||
| Expt D |
5 peptides |
9 spectra |
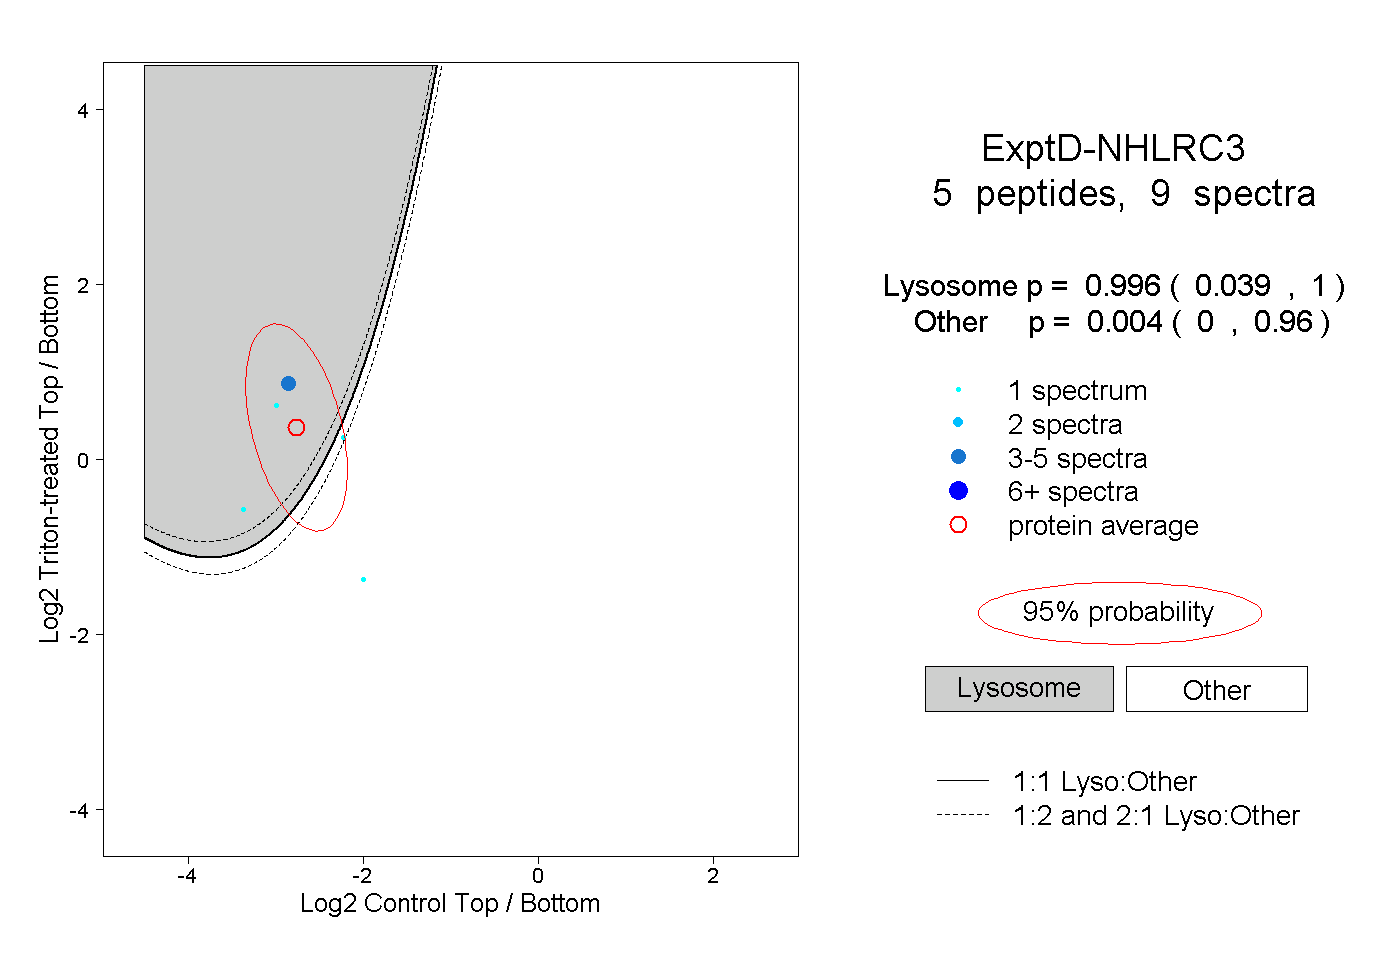 |
0.996 0.039 | 1.000 |
0.004 0.000 | 0.960 |