CELF1
[ENSRNOP00000014484]
Main page
| | | Plot |
Mito |
Lyso |
|
Perox |
ER |
Golgi |
PM |
Cytosol |
Nucleus |
|
| Expt A |
 10
10
peptides |
31
spectra |
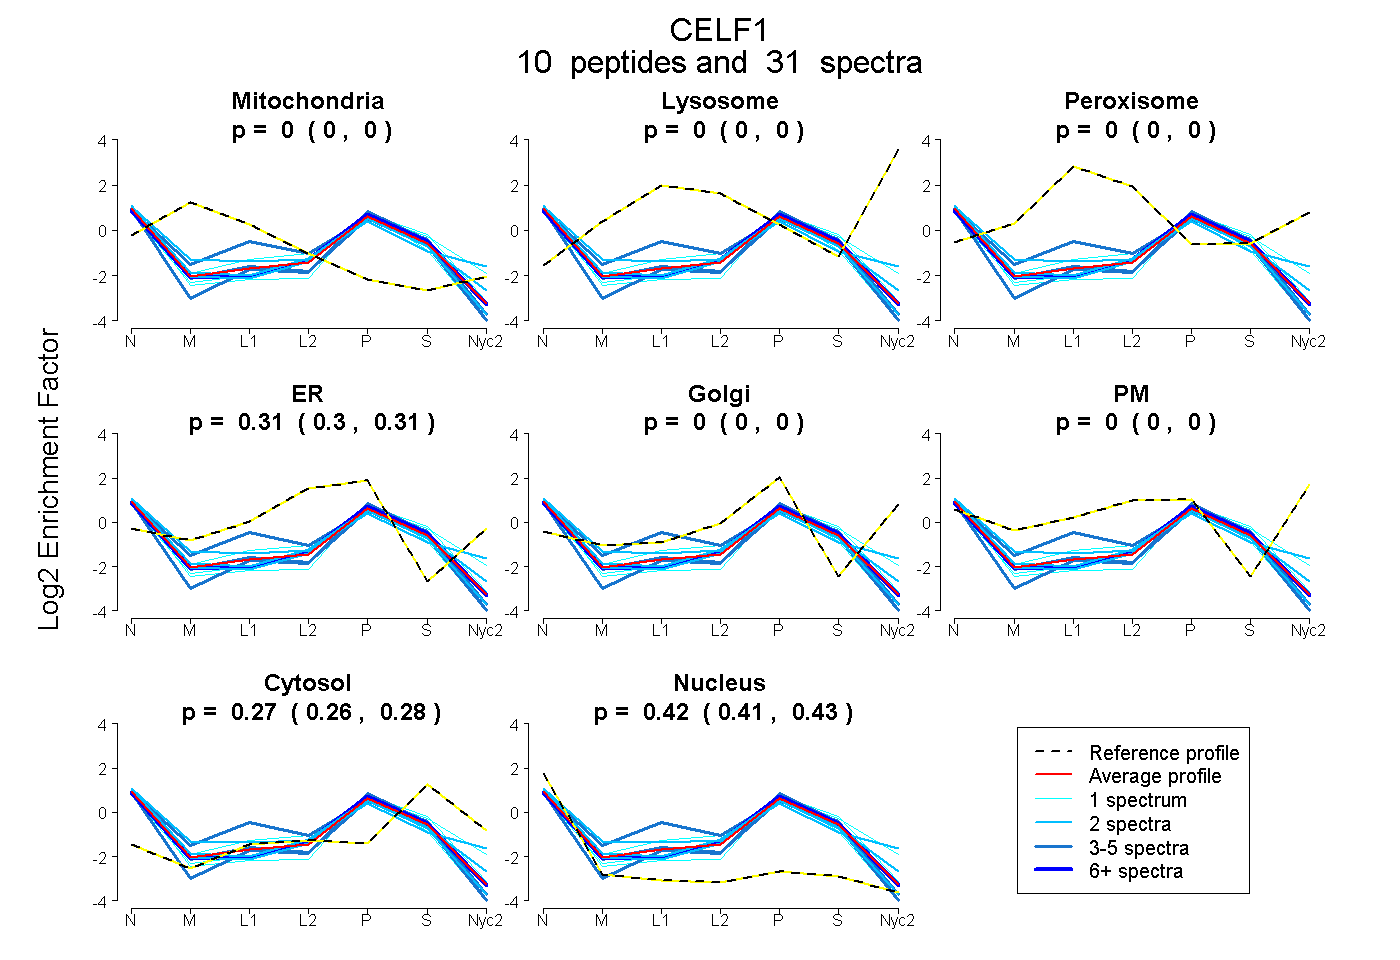 |
0.000
0.000 | 0.000 |
0.000
0.000 | 0.000 |
|
0.000
0.000 | 0.000 |
0.310
0.304 | 0.314 |
0.000
0.000 | 0.000 |
0.000
0.000 | 0.000 |
0.270
0.264 | 0.275 |
0.420
0.413 | 0.427 |
|
| | | Plot |
Mito |
|
Lyso or Perox |
|
ER |
Golgi |
PM |
Cytosol |
Nucleus |
|
| Expt B |
3
peptides |
4
spectra |
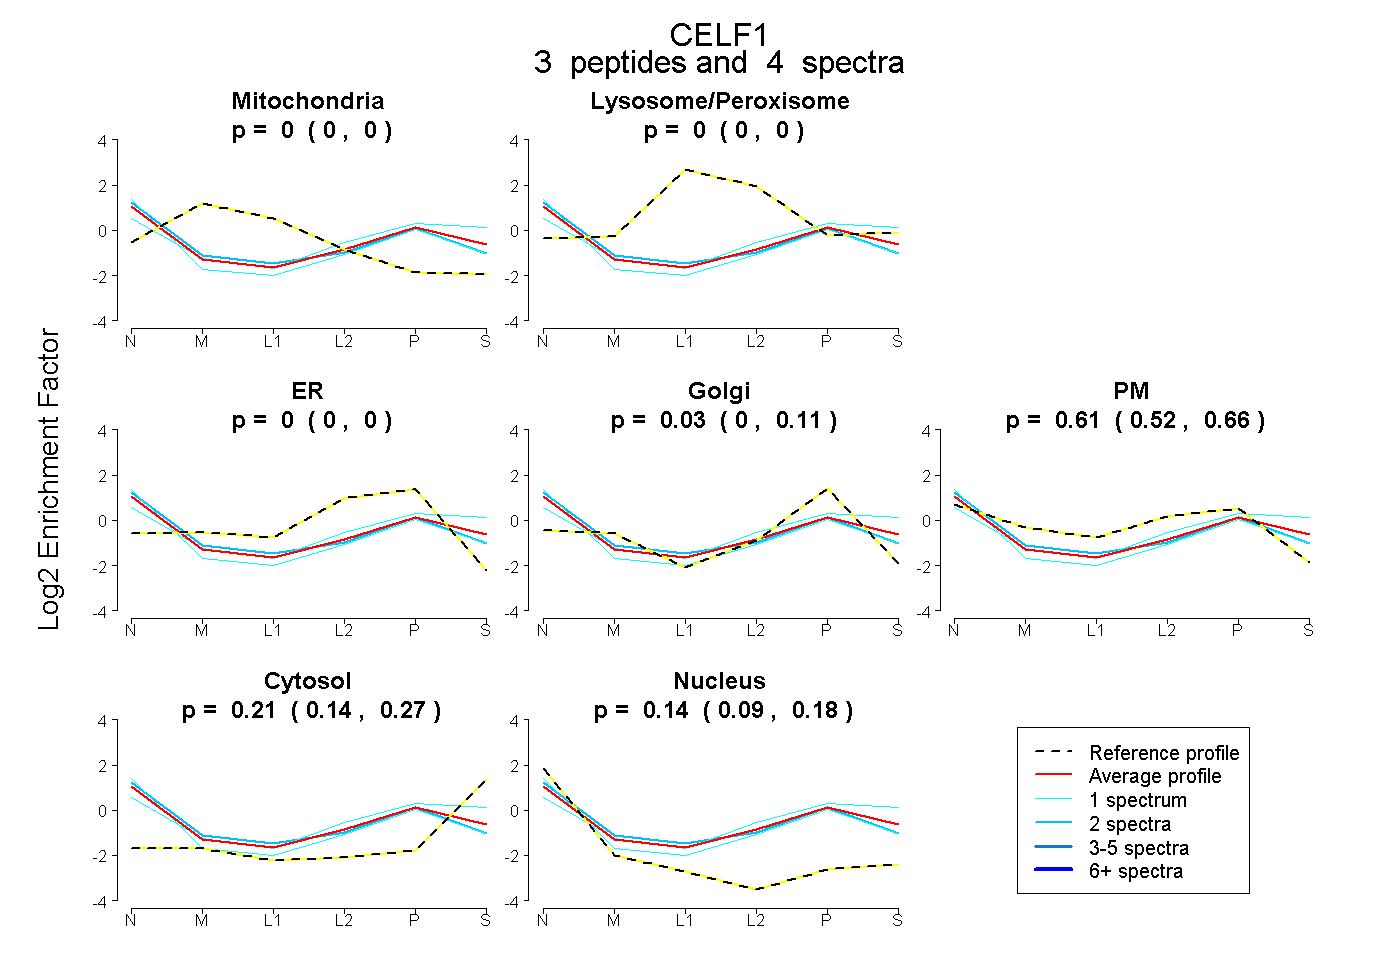 |
0.000
0.000 | 0.000 |
|
0.000
0.000 | 0.000 |
|
0.000
0.000 | 0.000 |
0.035
0.000 | 0.114 |
0.611
0.518 | 0.661 |
0.209
0.138 | 0.271 |
0.145
0.093 | 0.185 |
|
| | | Plot |
|
Lyso |
|
|
|
|
|
|
|
Other |
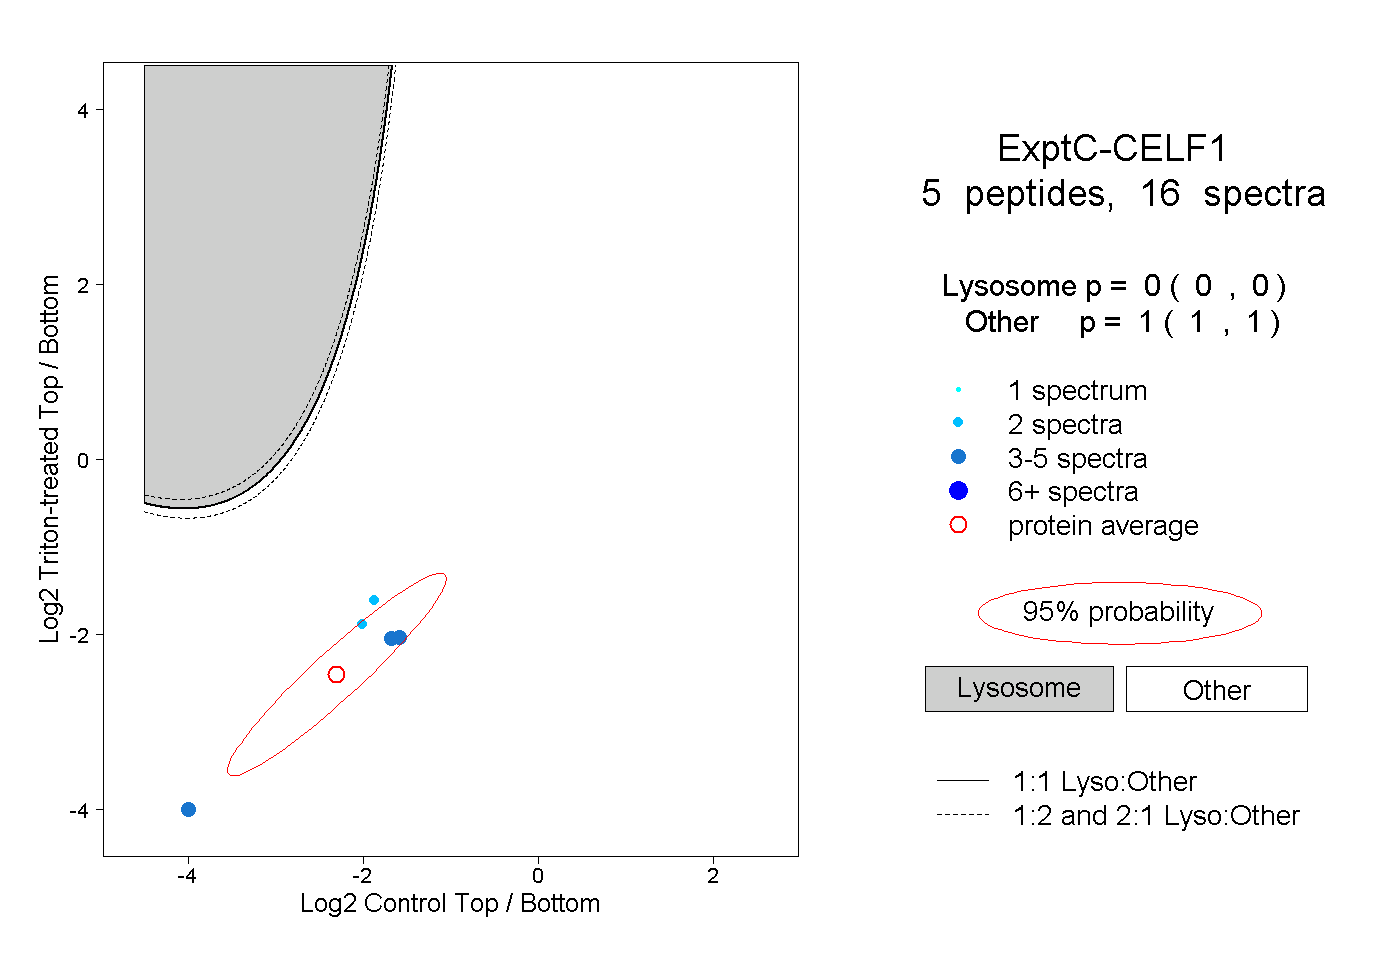
| Expt C |
5
peptides |
16
spectra |
 |
|
0.000
0.000 | 0.000 |
|
|
|
|
|
|
|
1.000
1.000 | 1.000 |
| 2 spectra, CTENDIR |
|
0.000 |
|
|
|
|
|
|
|
1.000 |
| 4 spectra, LFIGMISK |
|
0.000 |
|
|
|
|
|
|
|
1.000 |
| 4 spectra, SQNPPQSK |
|
0.000 |
|
|
|
|
|
|
|
1.000 |
| 2 spectra, GPDGLSR |
|
0.000 |
|
|
|
|
|
|
|
1.000 |
| 4 spectra, FADTQK |
|
0.000 |
|
|
|
|
|
|
|
1.000 |
| | | Plot |
|
Lyso |
|
|
|
|
|
|
|
Other |
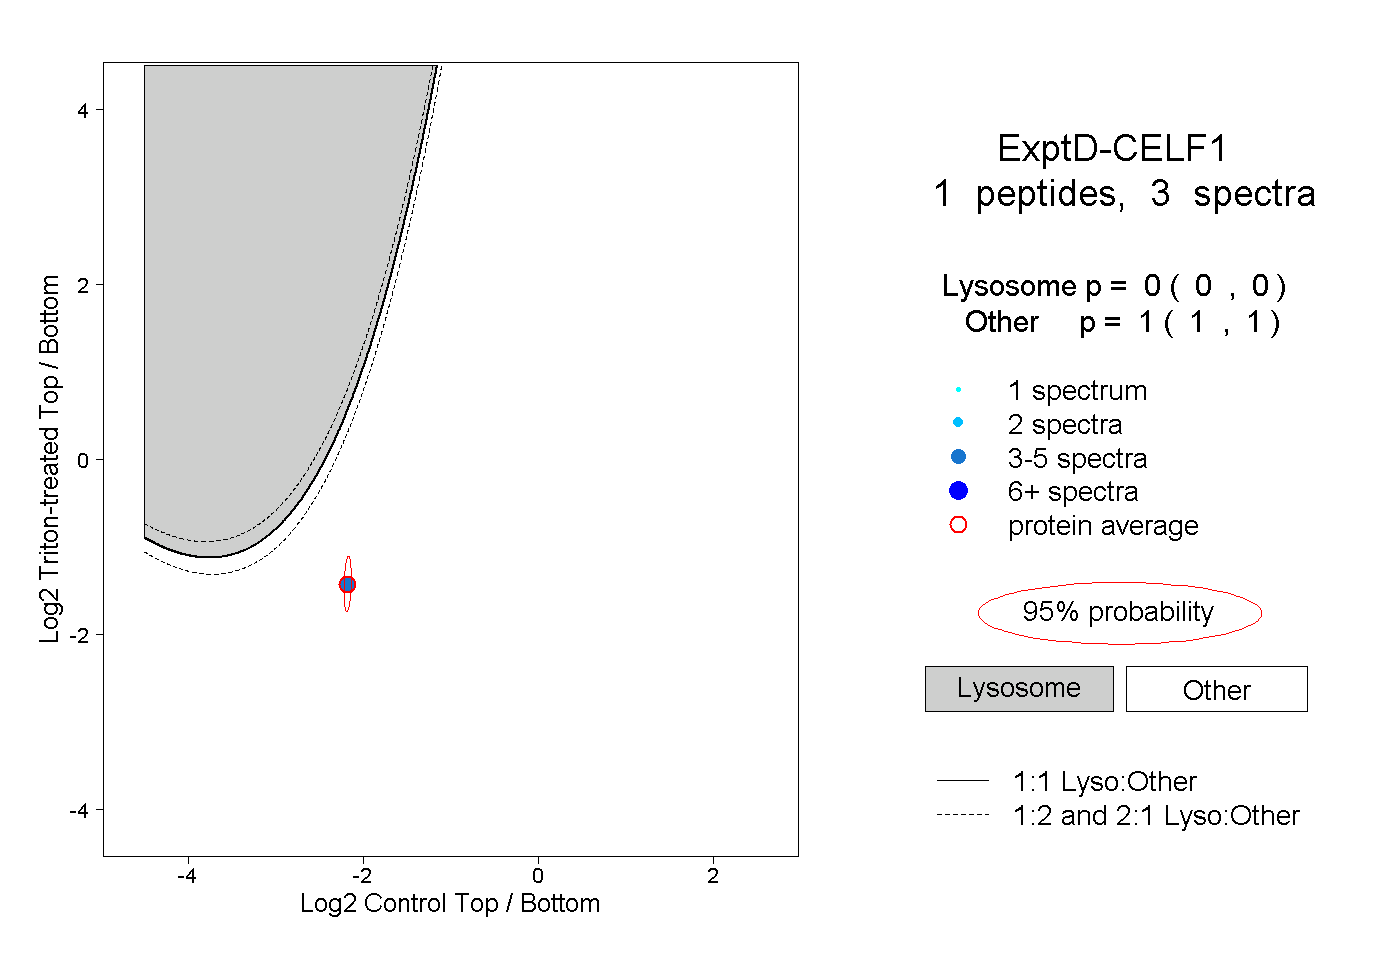
| Expt D |
1
peptide |
3
spectra |
 |
|
0.000
0.000 | 0.000 |
|
|
|
|
|
|
|
1.000
1.000 | 1.000 |