 2
2peptides
spectra
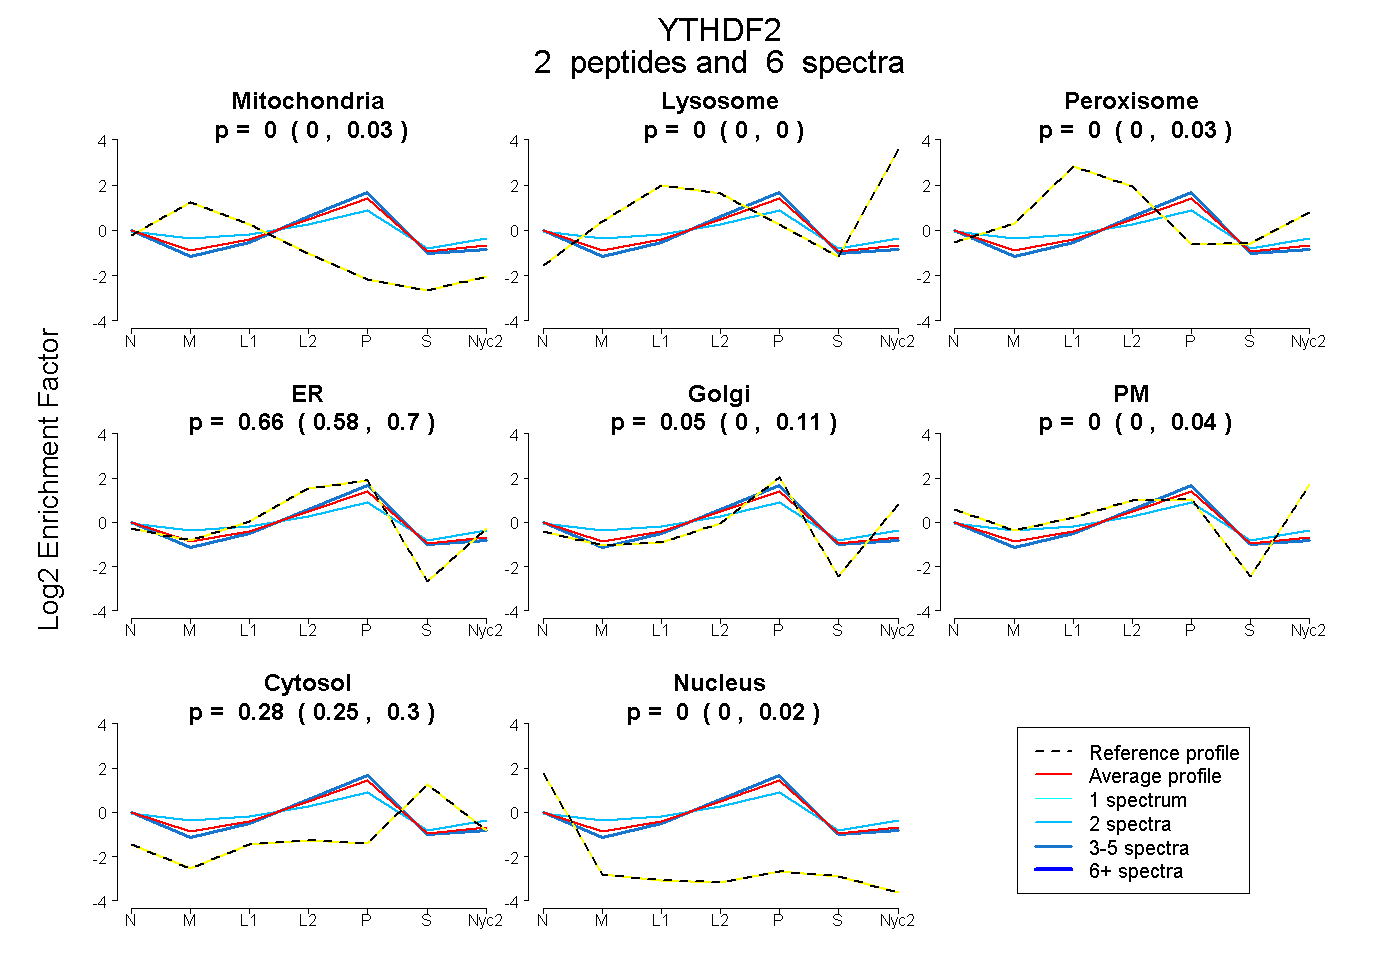
0.000 | 0.032
0.000 | 0.000
0.000 | 0.028
0.579 | 0.696
0.000 | 0.110
0.000 | 0.037
0.246 | 0.303
0.000 | 0.016
4peptides
spectra
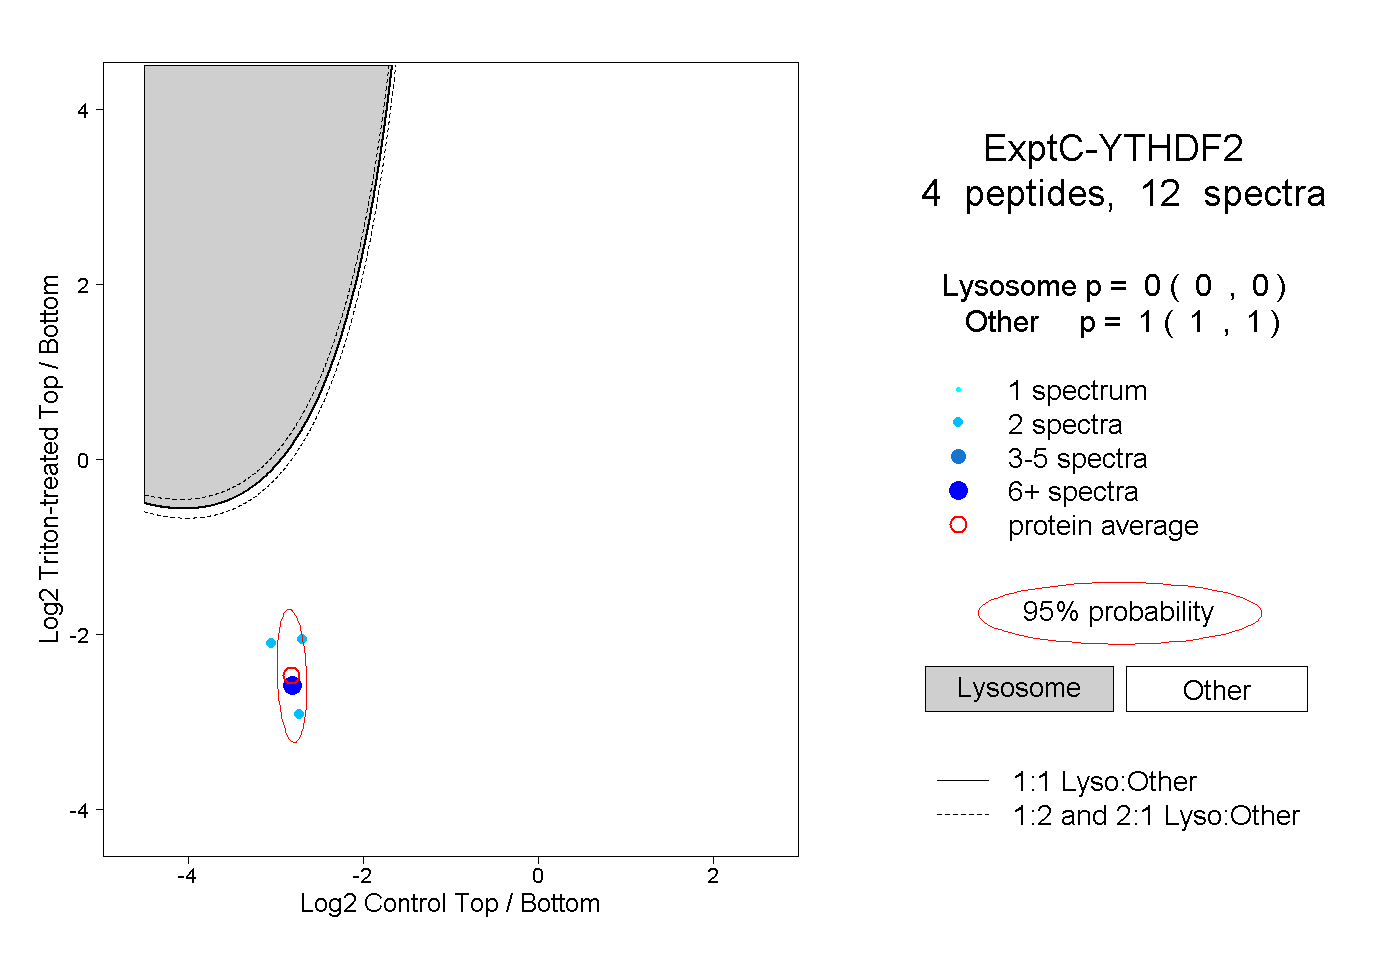
0.000 | 0.000
1.000 | 1.000
1peptide
spectra
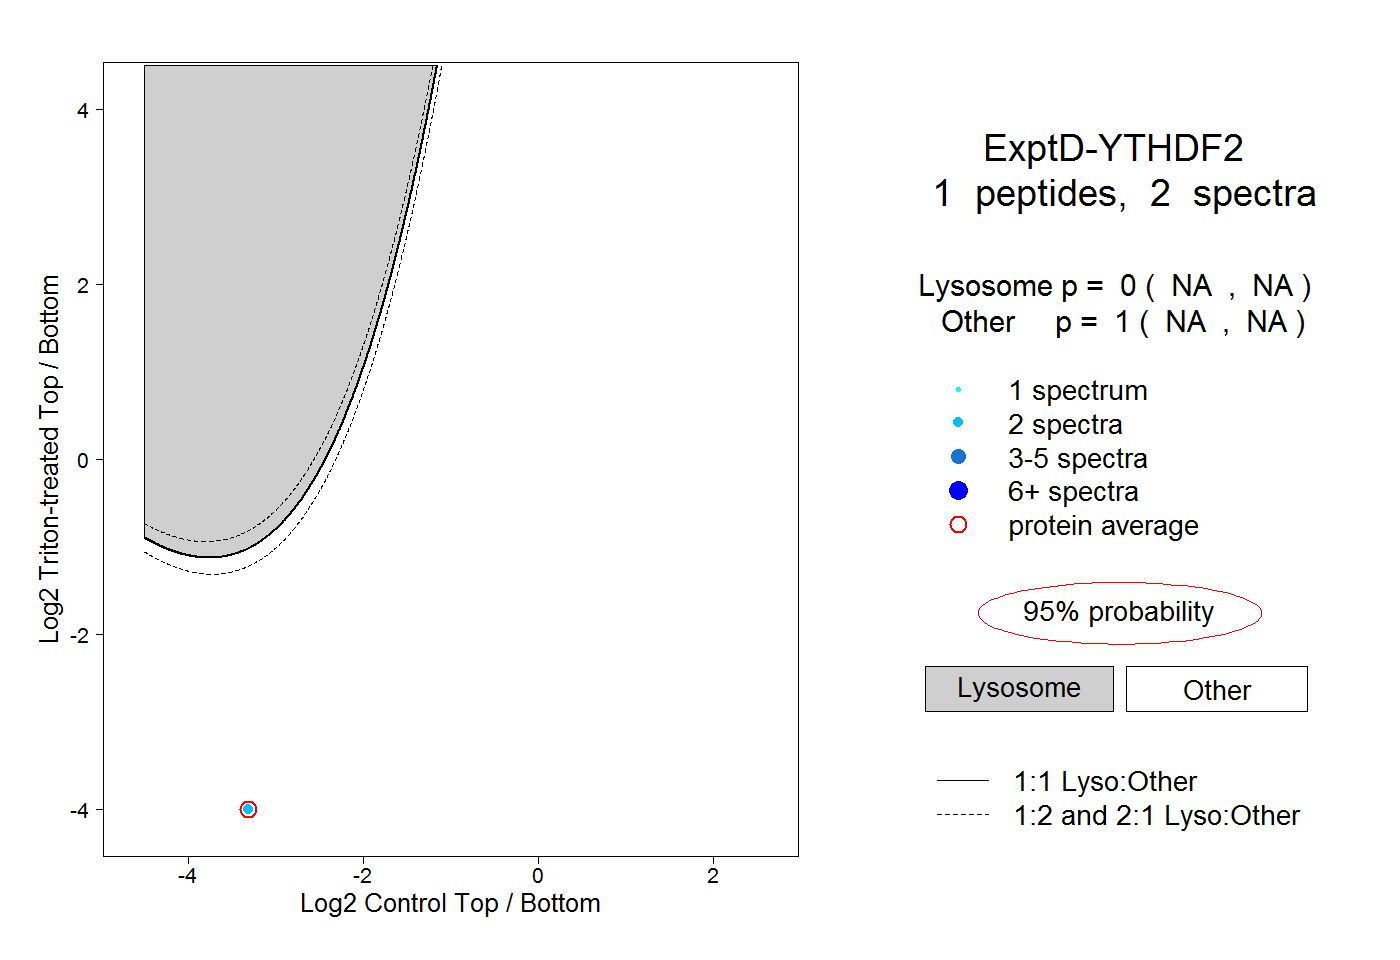
NA | NA
NA | NA