 40
40peptides
spectra
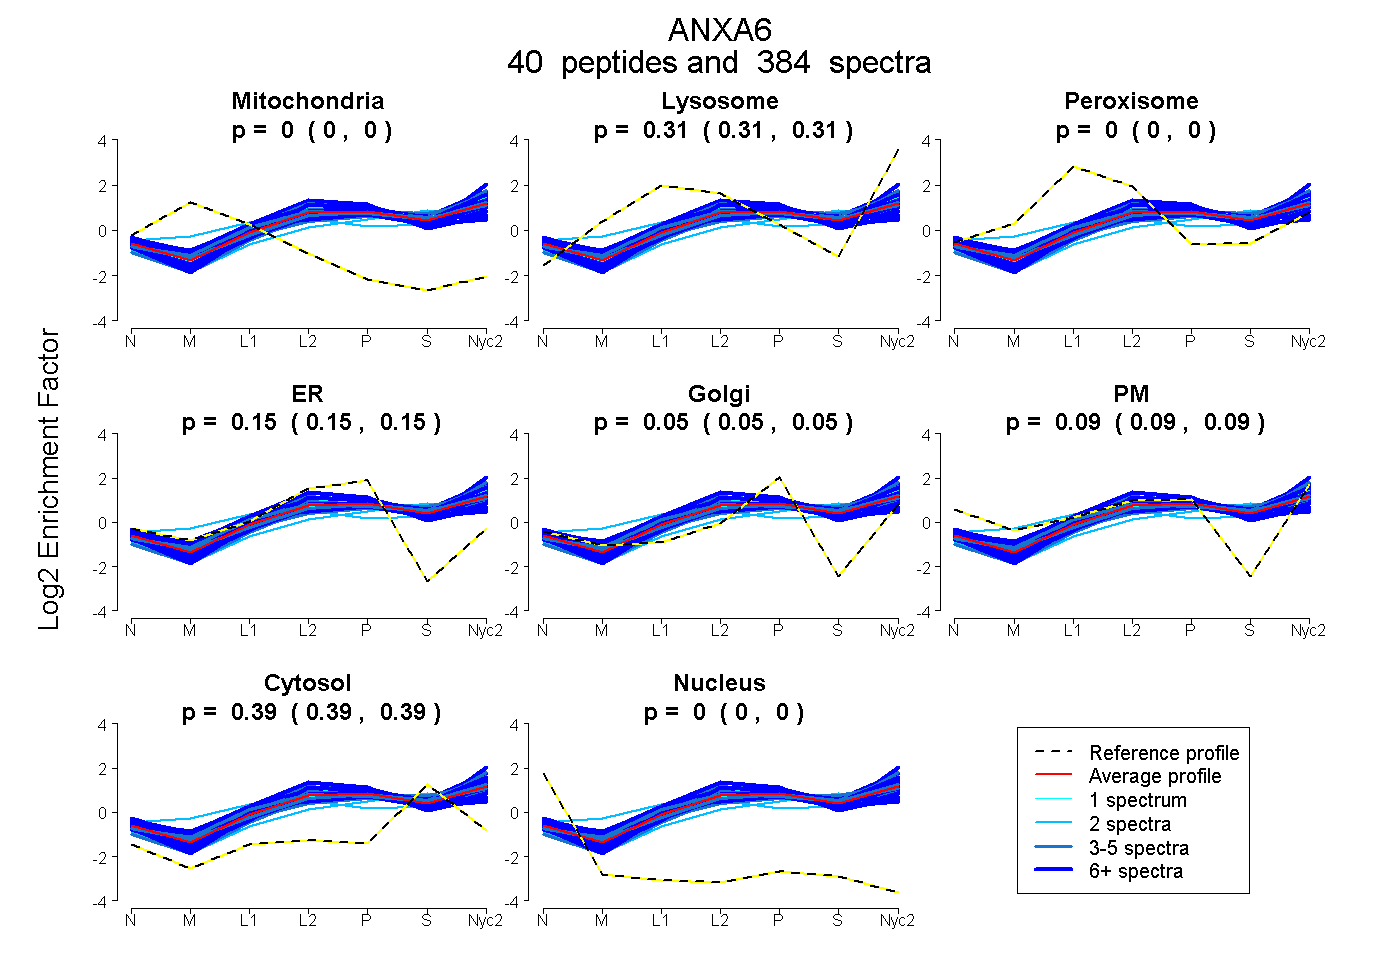
0.000 | 0.000
0.313 | 0.315
0.000 | 0.000
0.149 | 0.153
0.046 | 0.049
0.091 | 0.094
0.394 | 0.395
0.000 | 0.000
32peptides
spectra
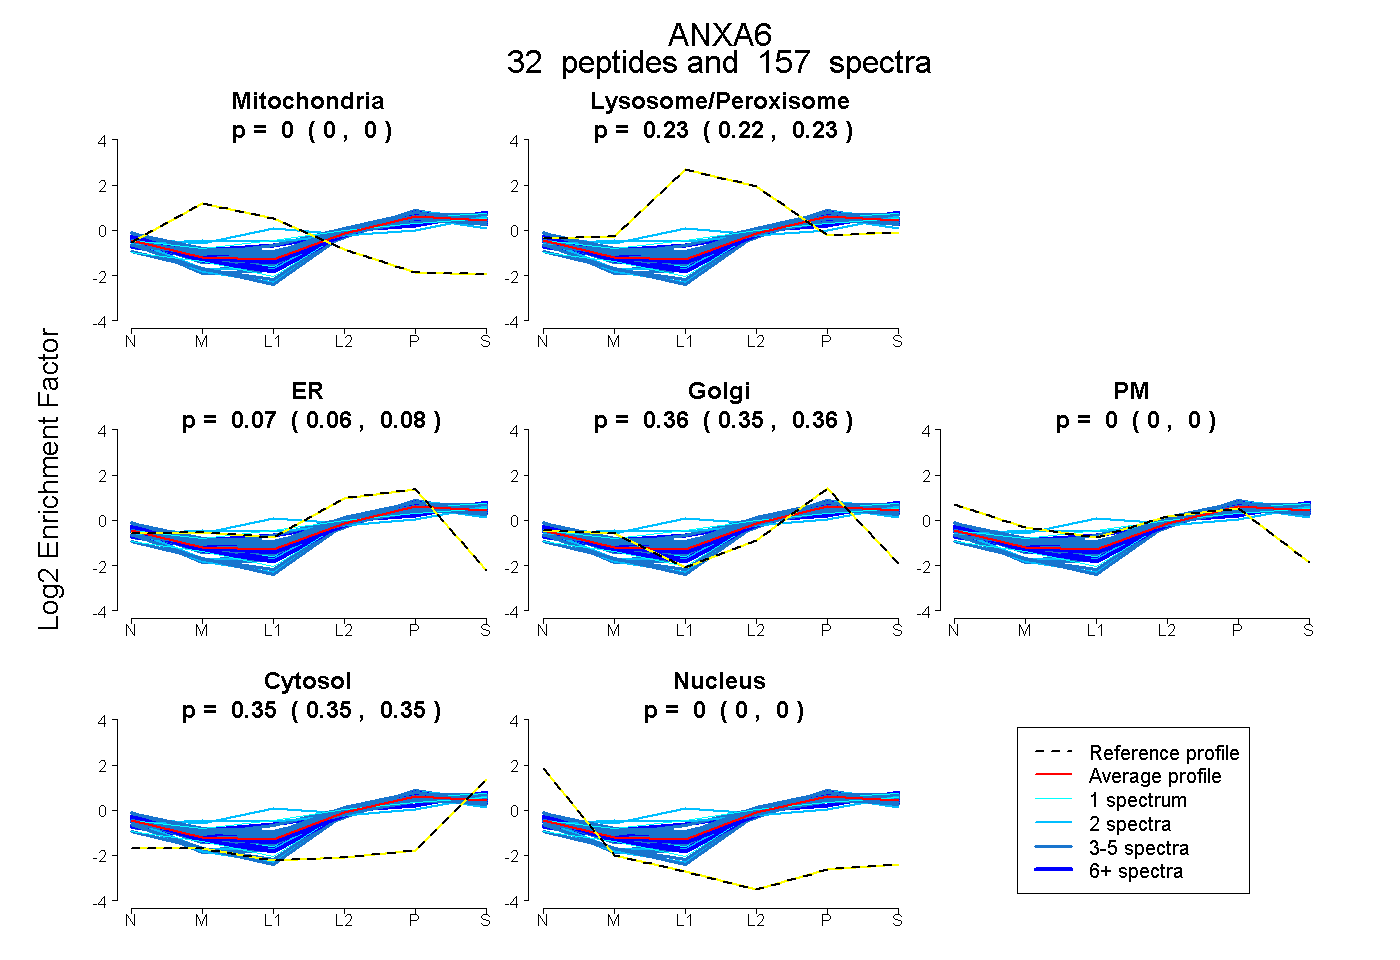
0.000 | 0.000
0.221 | 0.229
0.062 | 0.076
0.351 | 0.363
0.000 | 0.000
0.345 | 0.350
0.000 | 0.000
40peptides
spectra
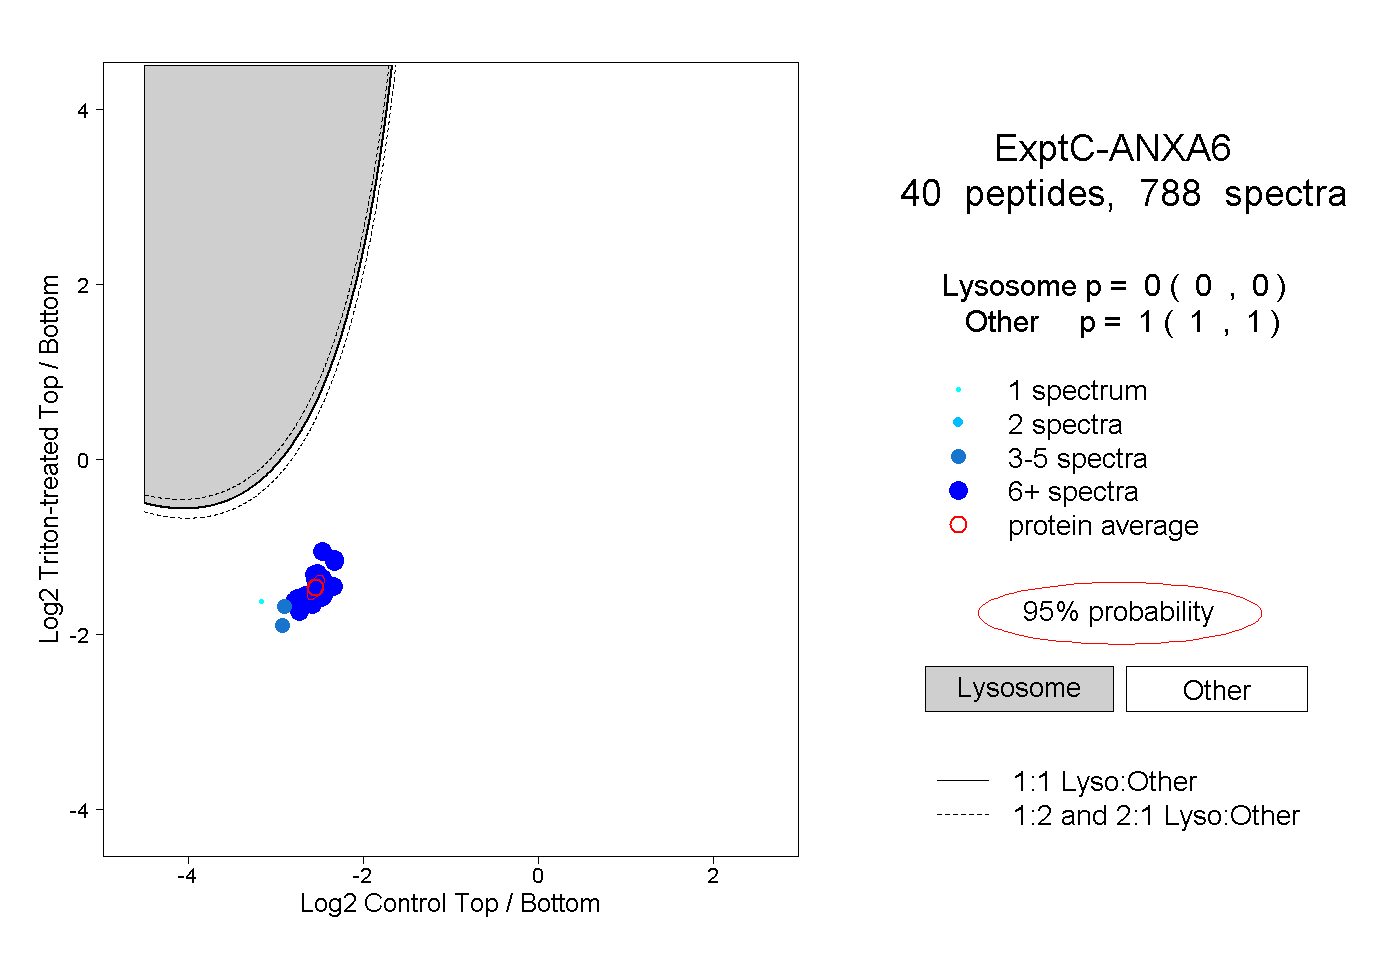
0.000 | 0.000
1.000 | 1.000
20peptides
spectra
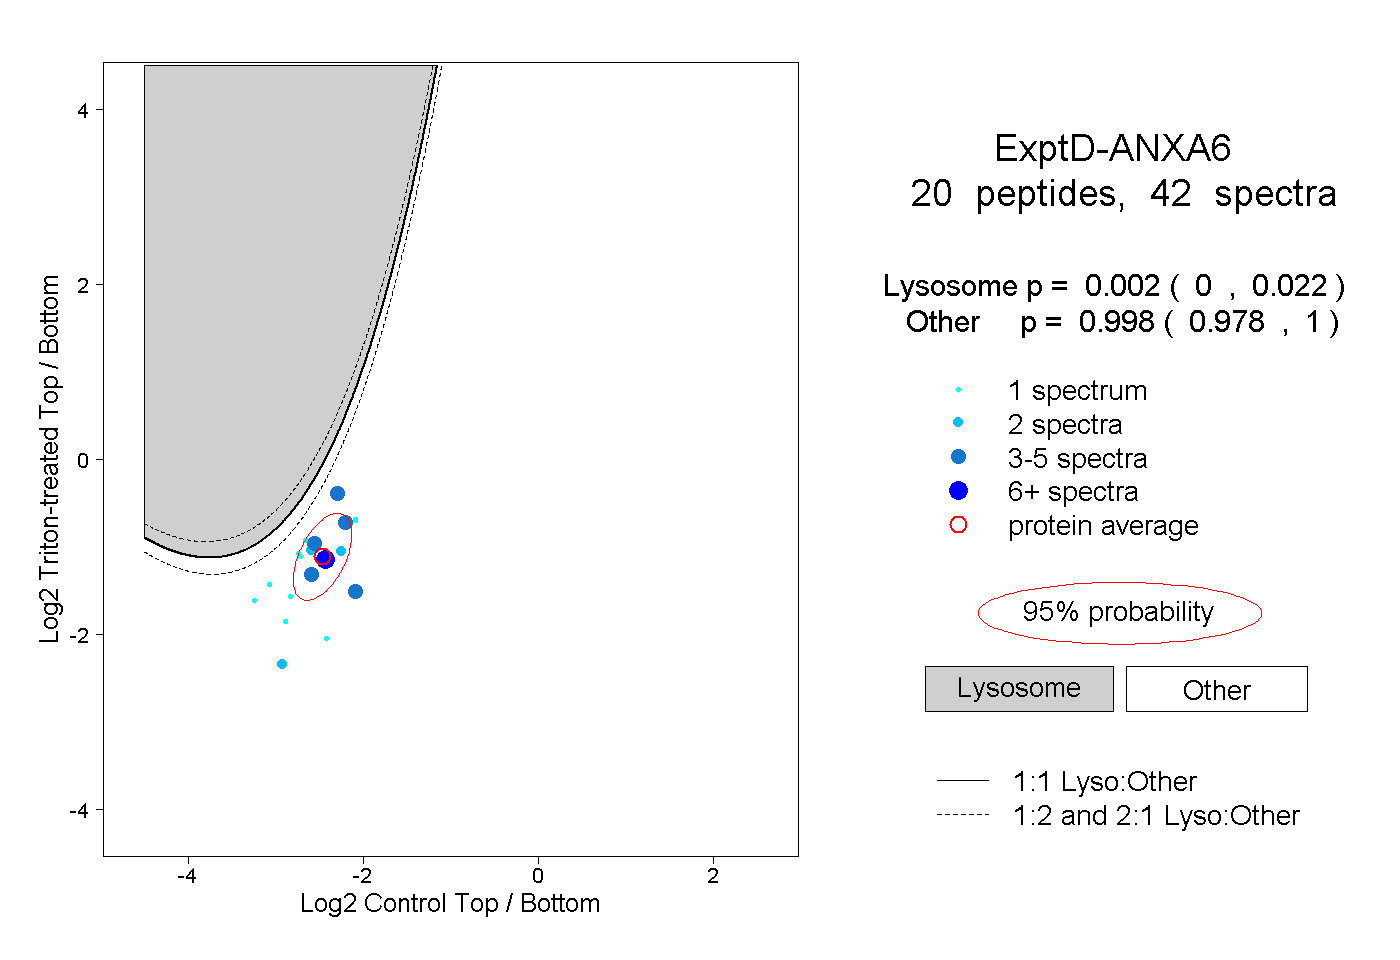
0.000 | 0.022
0.978 | 1.000