 2
2peptides
spectra
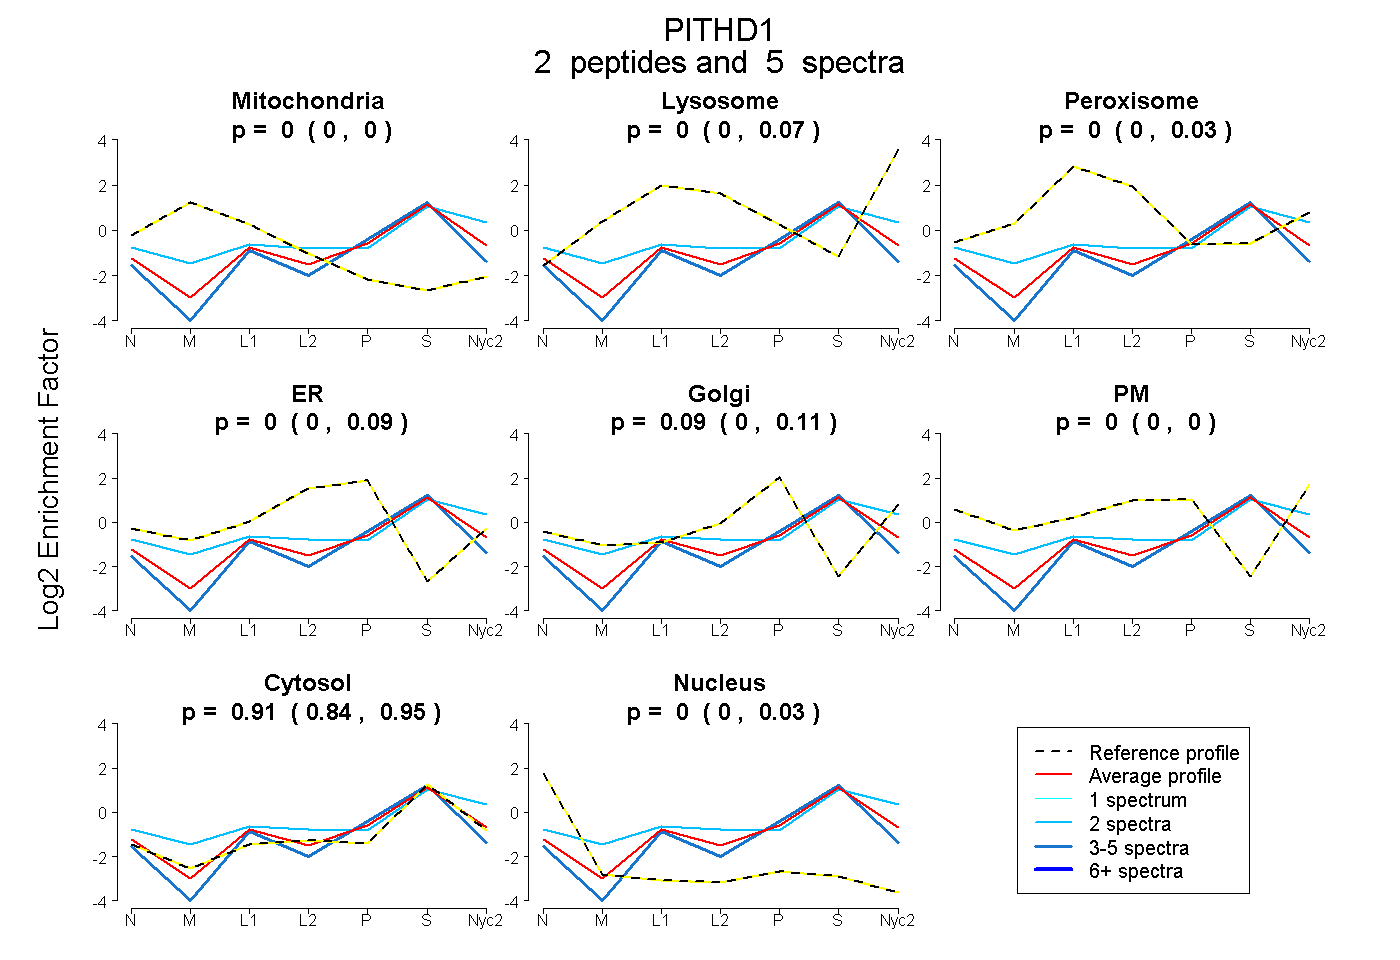
0.000 | 0.000
0.000 | 0.067
0.000 | 0.028
0.000 | 0.089
0.000 | 0.106
0.000 | 0.004
0.844 | 0.946
0.000 | 0.031
2peptides
spectra
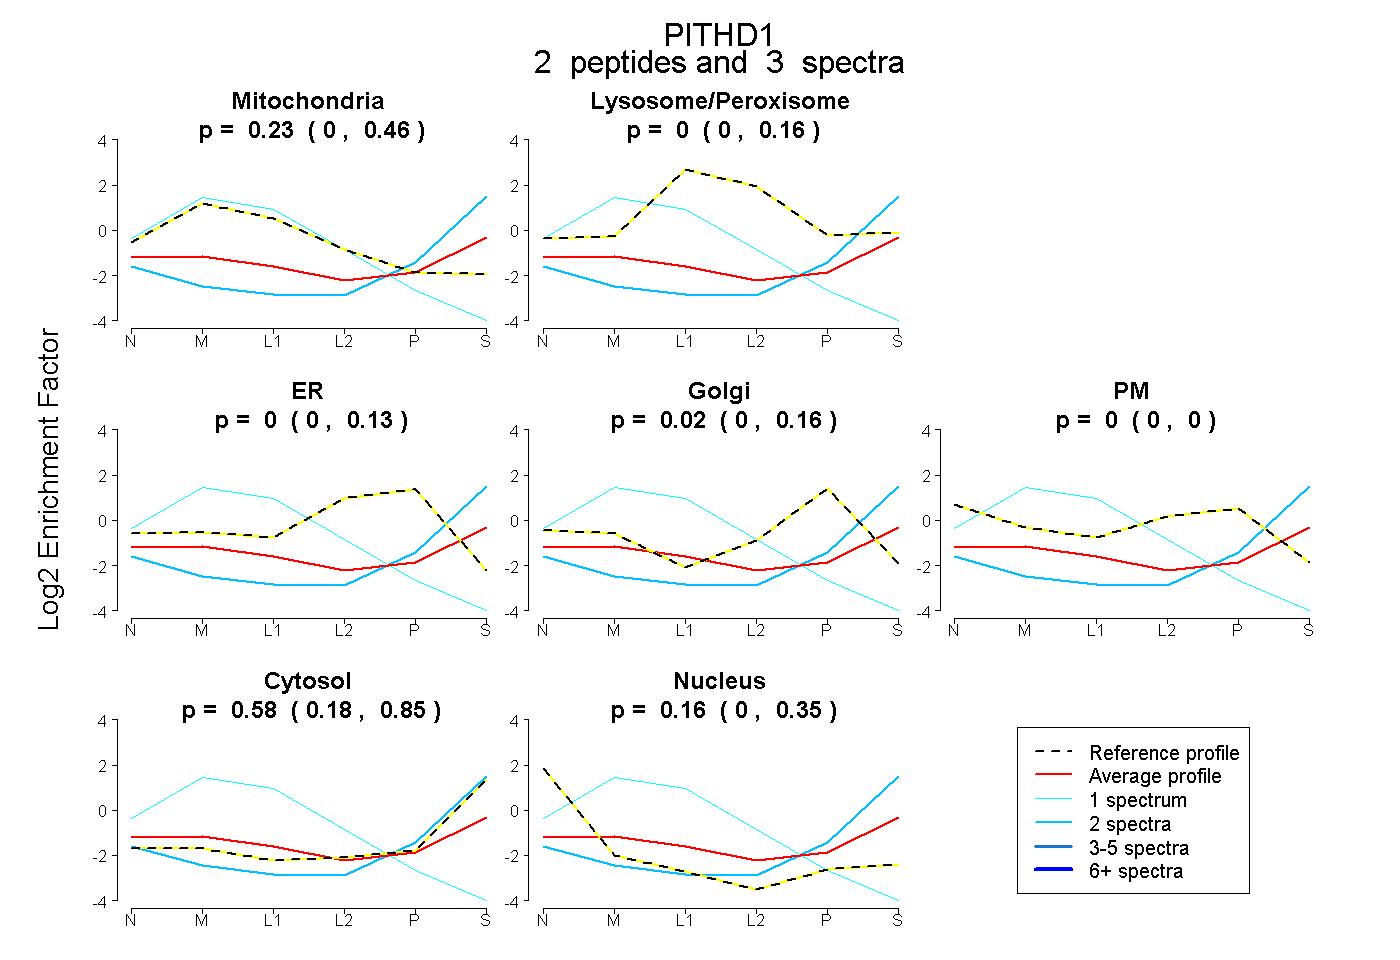
0.000 | 0.456
0.000 | 0.158
0.000 | 0.128
0.000 | 0.161
0.000 | 0.000
0.176 | 0.849
0.000 | 0.353
3peptides
spectra

0.000 | 0.000
1.000 | 1.000
2peptides
spectra
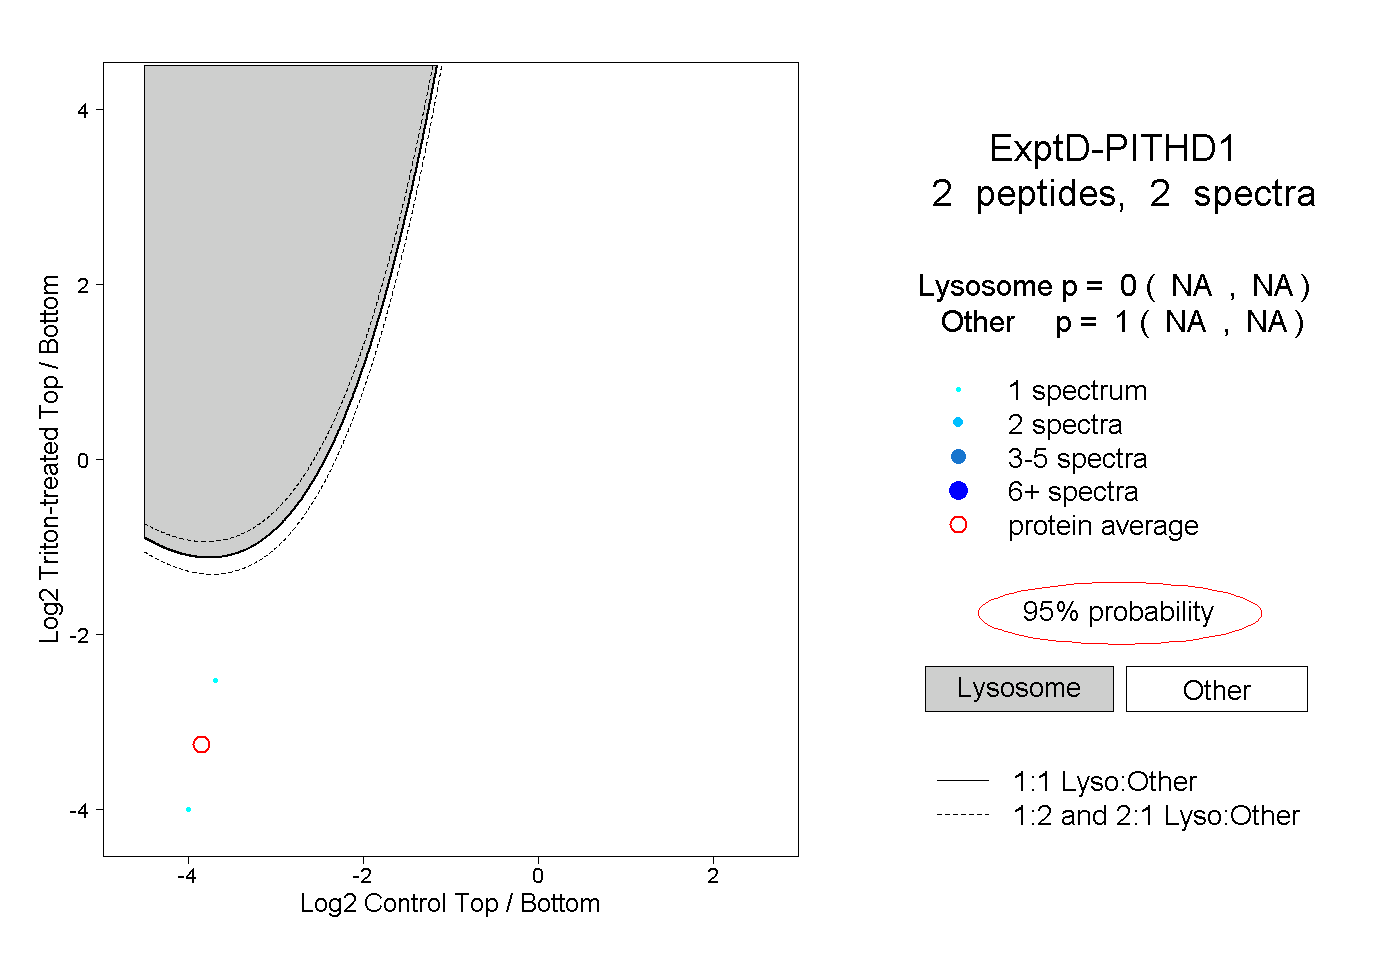
NA | NA
NA | NA