 3
3peptides
spectra
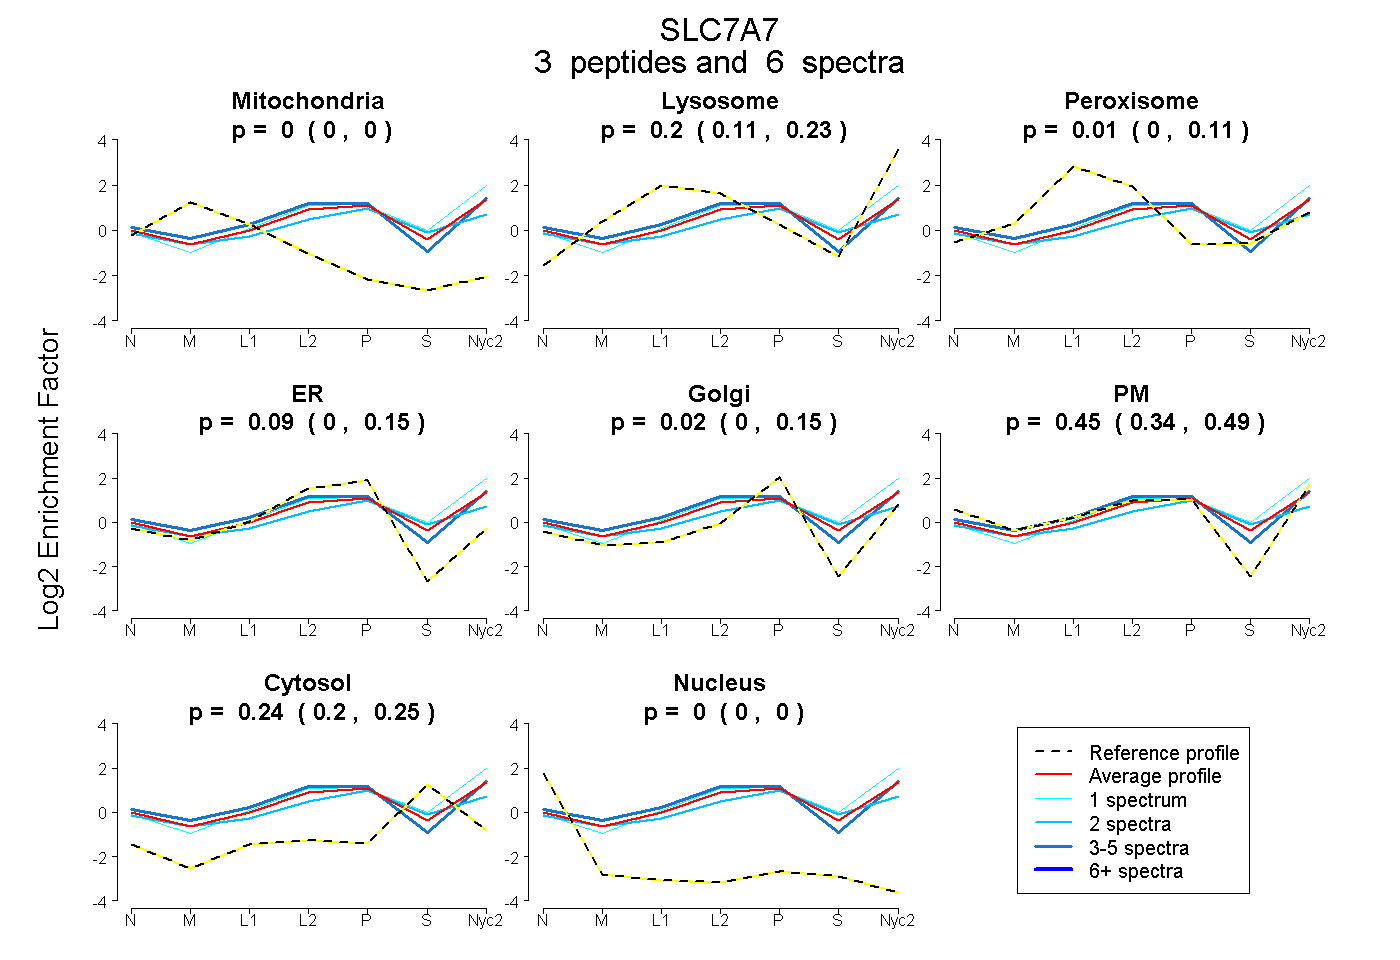
0.000 | 0.000
0.109 | 0.235
0.000 | 0.107
0.000 | 0.153
0.000 | 0.153
0.344 | 0.493
0.198 | 0.254
0.000 | 0.000
2peptides
spectra
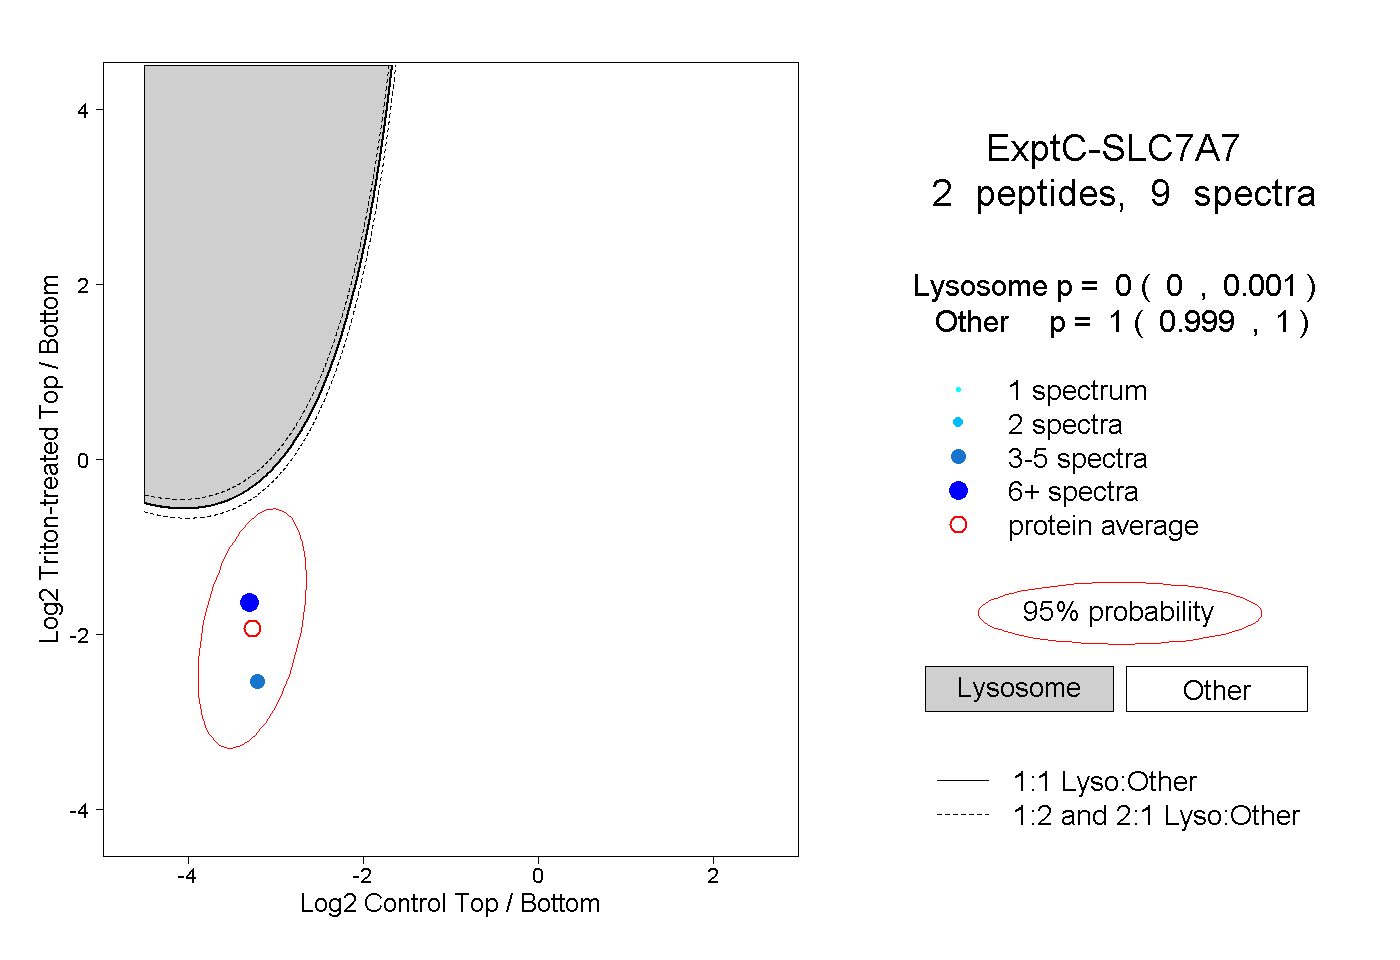
0.000 | 0.001
0.999 | 1.000
1peptide
spectrum
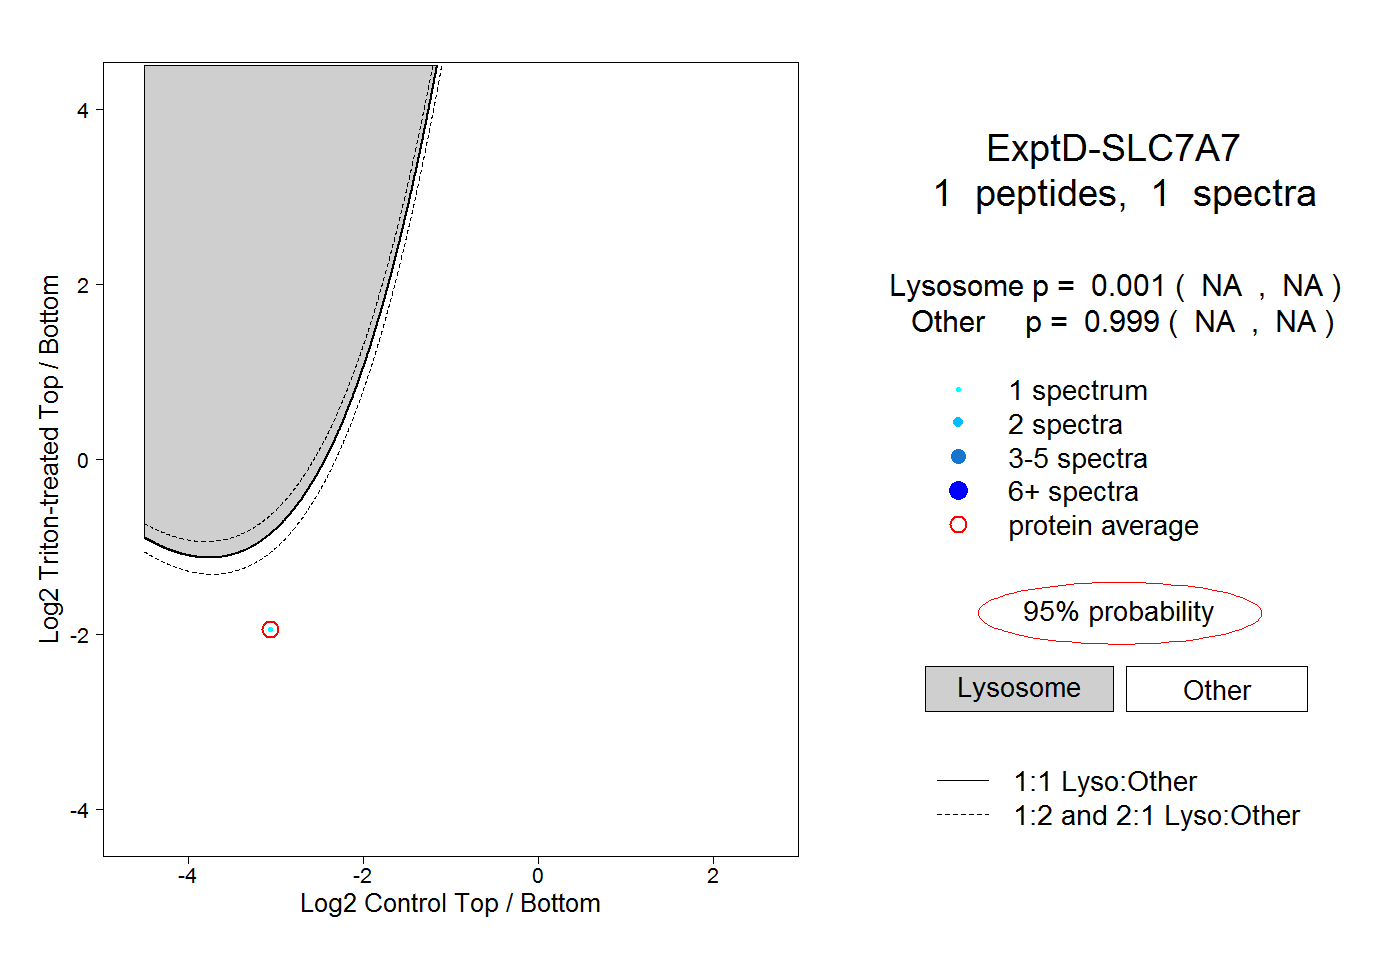
NA | NA
NA | NA