 8
8peptides
spectra
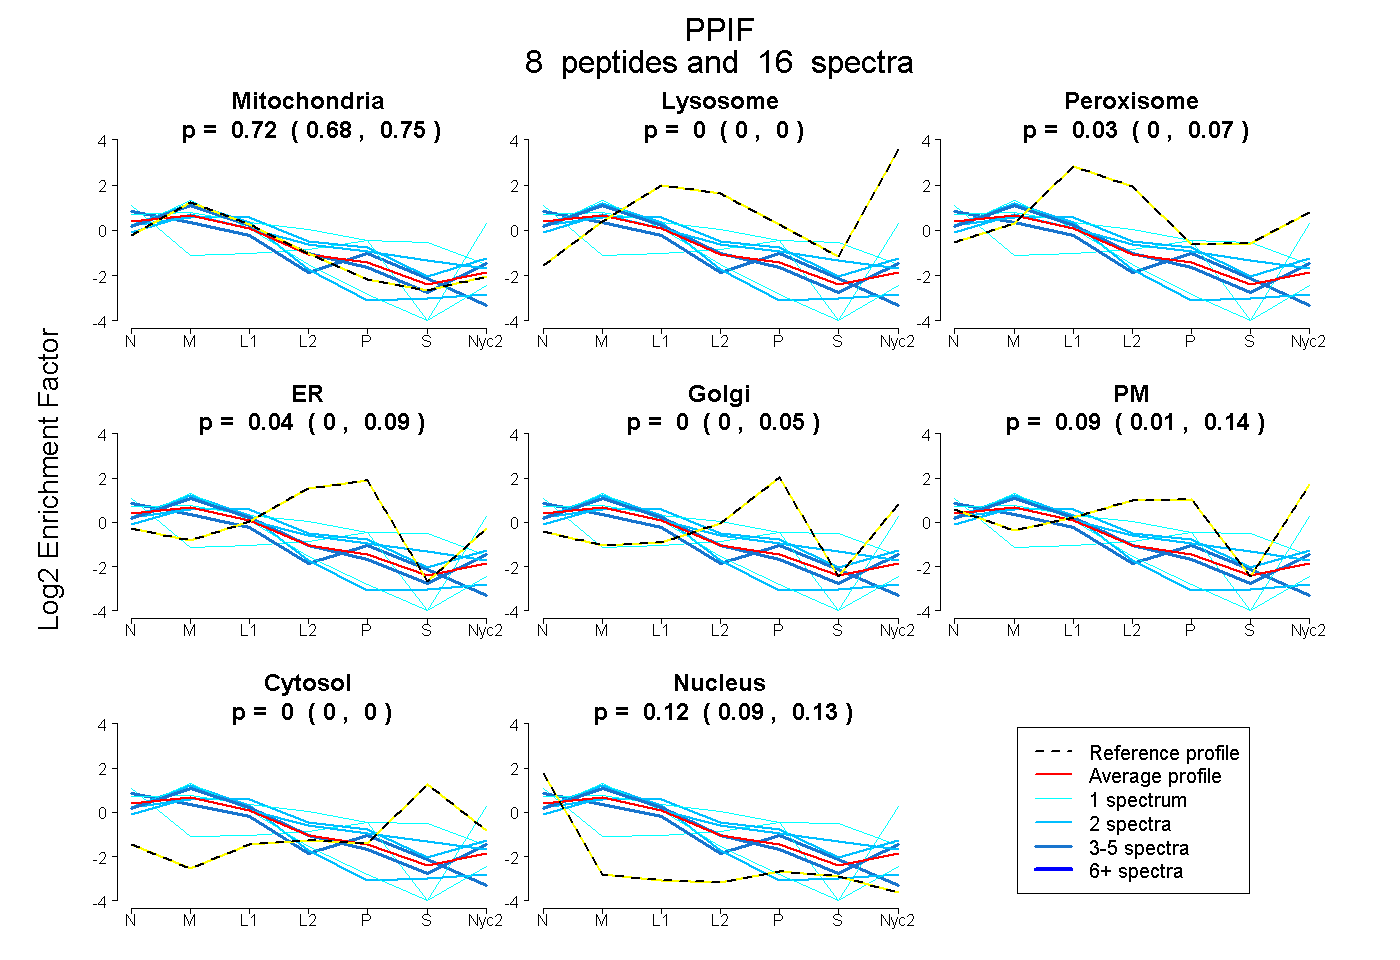
0.675 | 0.749
0.000 | 0.000
0.000 | 0.072
0.000 | 0.094
0.000 | 0.051
0.009 | 0.142
0.000 | 0.000
0.091 | 0.135
9peptides
spectra
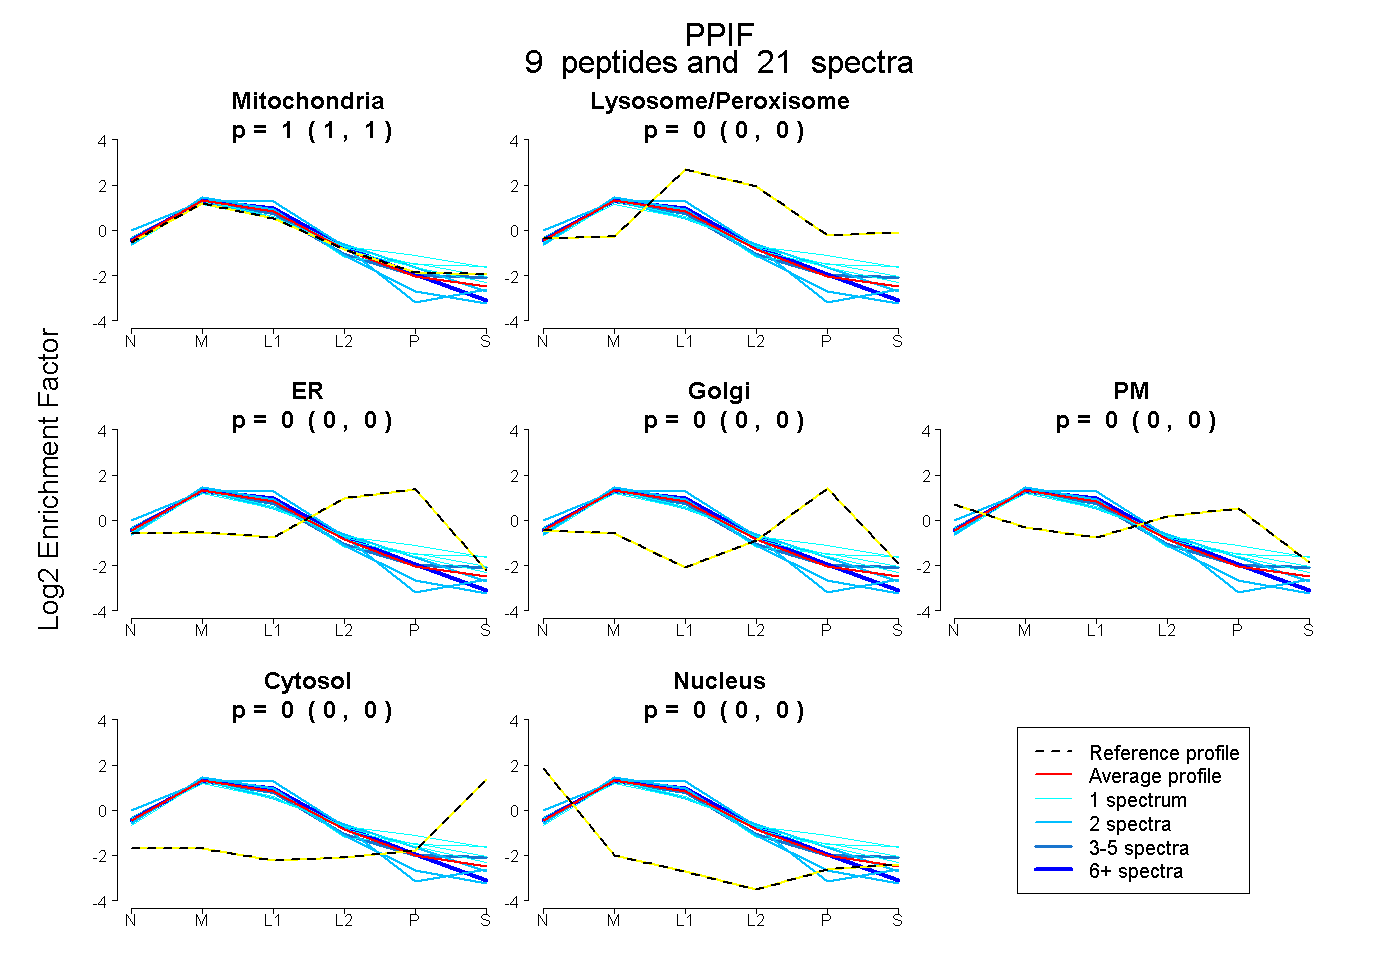
1.000 | 1.000
0.000 | 0.000
0.000 | 0.000
0.000 | 0.000
0.000 | 0.000
0.000 | 0.000
0.000 | 0.000
8peptides
spectra
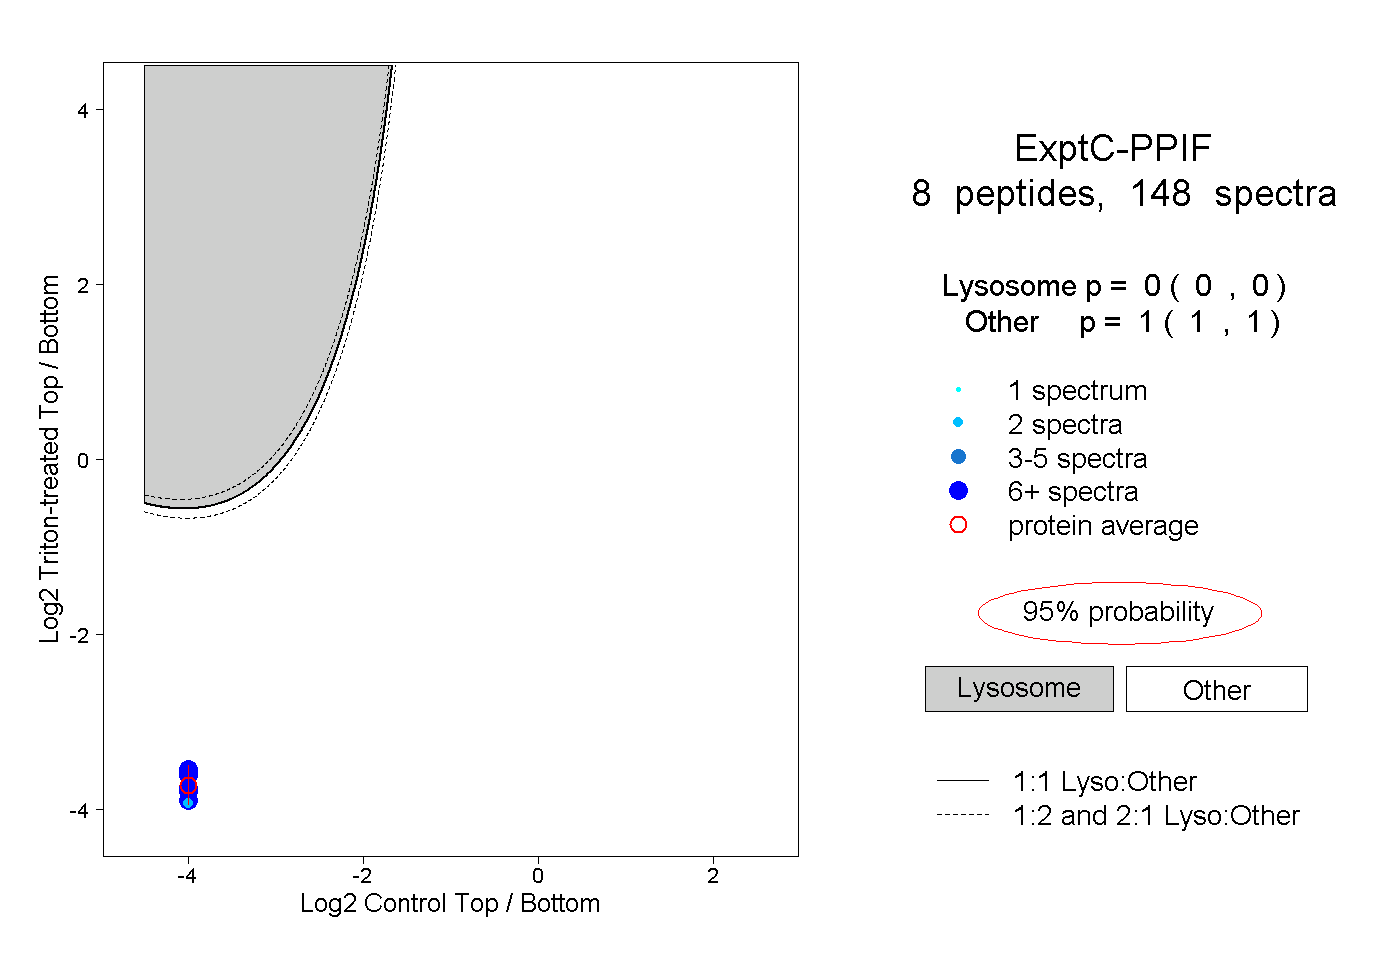
0.000 | 0.000
1.000 | 1.000
6peptides
spectra
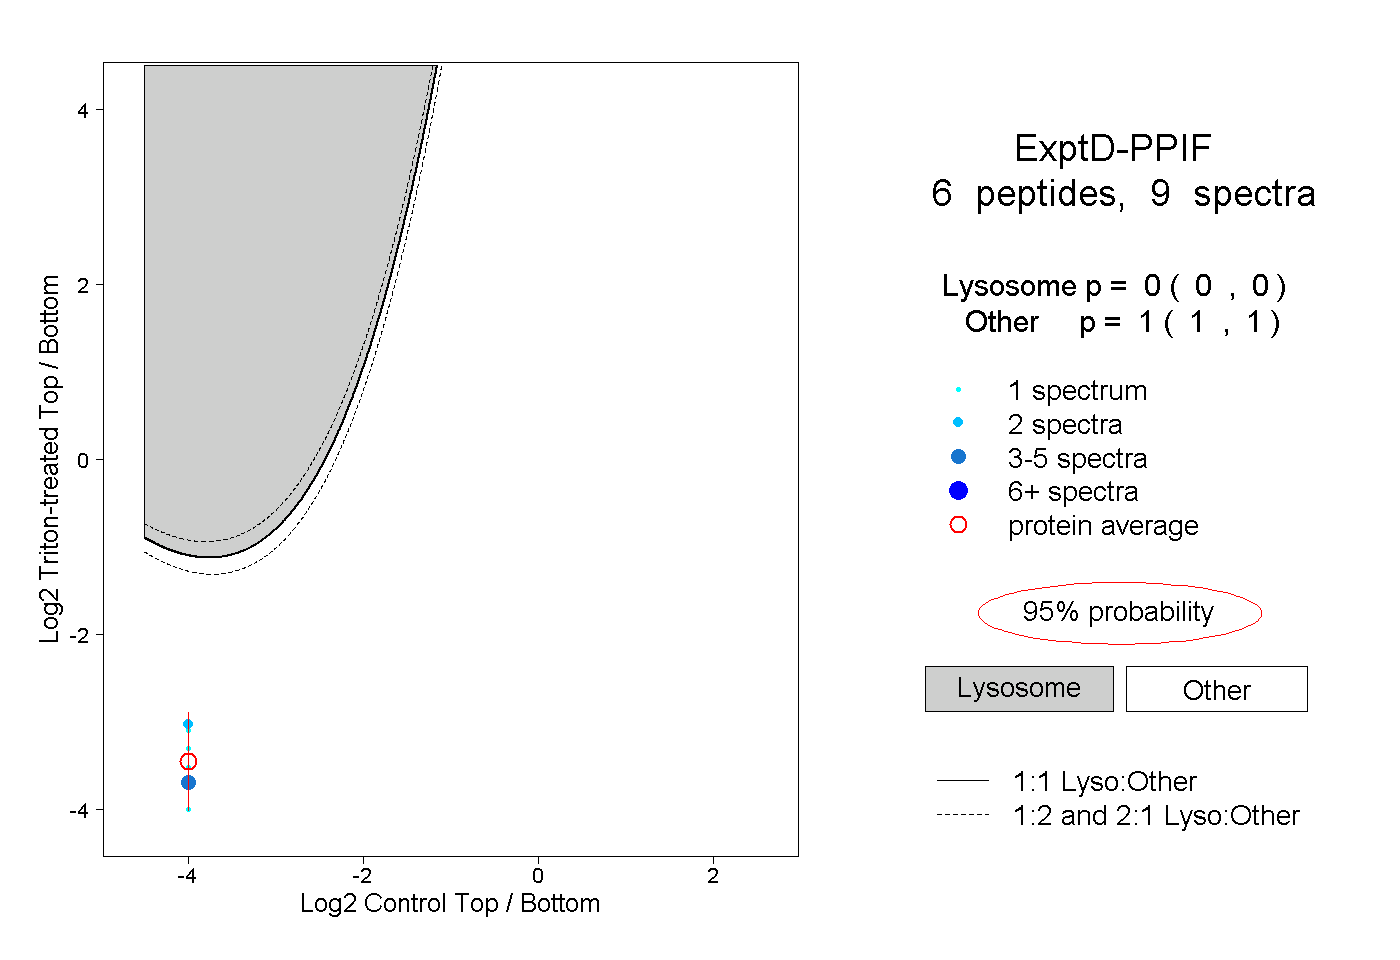
0.000 | 0.000
1.000 | 1.000