 1
1peptide
spectrum
NA | NA
NA | NA
NA | NA
NA | NA
NA | NA
NA | NA
NA | NA
NA | NA
8peptides
spectra
0.000 | 0.000
1.000 | 1.000
| Plot | Mito | Lyso | Perox | ER | Golgi | PM | Cytosol | Nucleus | |||||
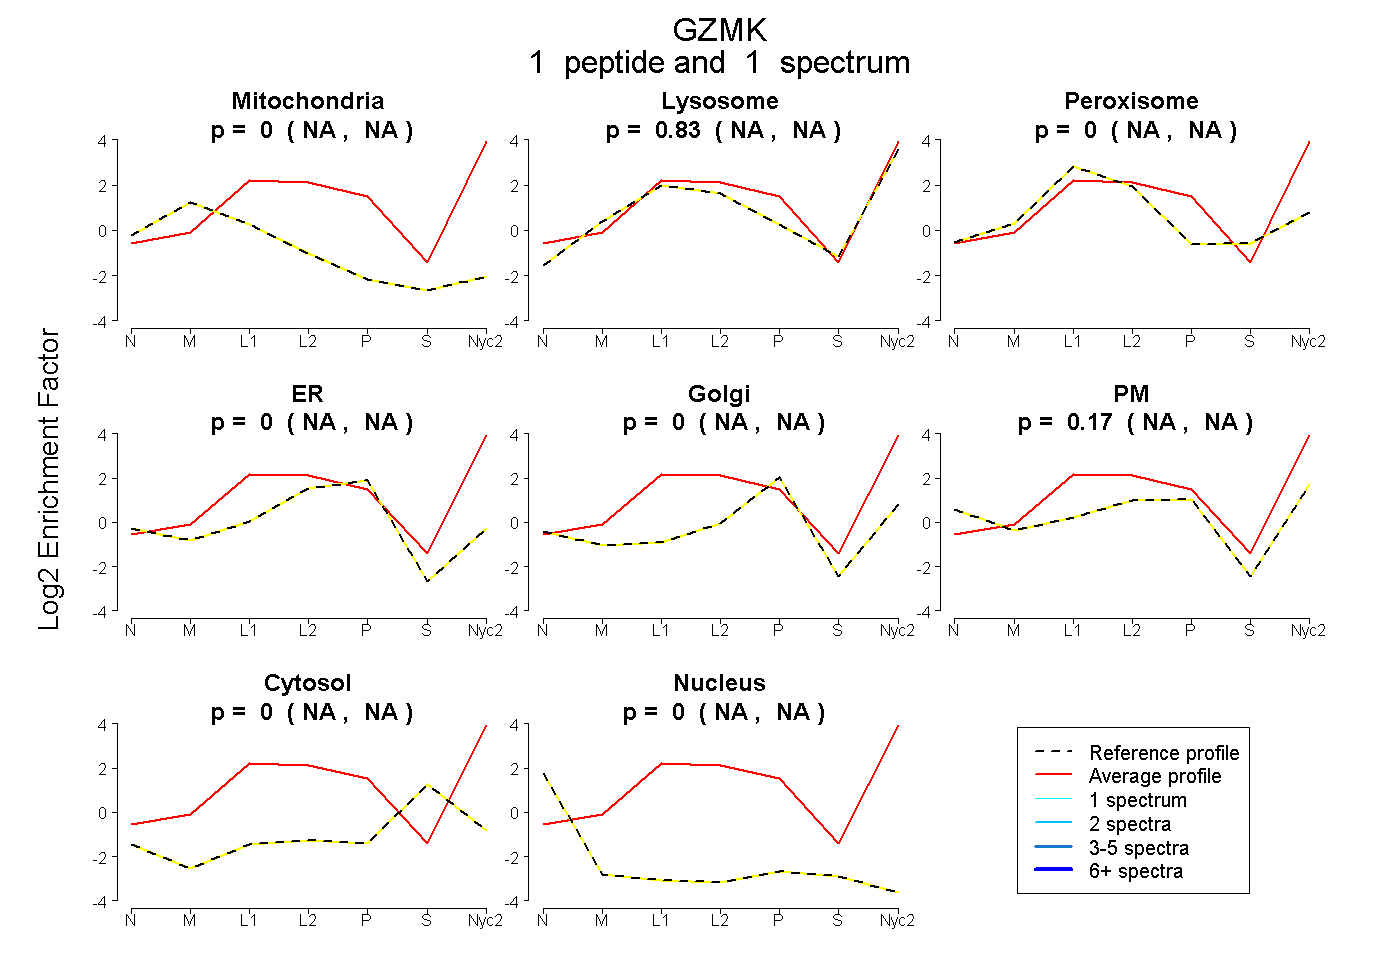
| Expt A |
1 peptide |
1 spectrum |
|
0.000 NA | NA |
0.831 NA | NA |
0.000 NA | NA |
0.000 NA | NA |
0.000 NA | NA |
0.169 NA | NA |
0.000 NA | NA |
0.000 NA | NA |
||
| Plot | Lyso | Other | |||||||||||
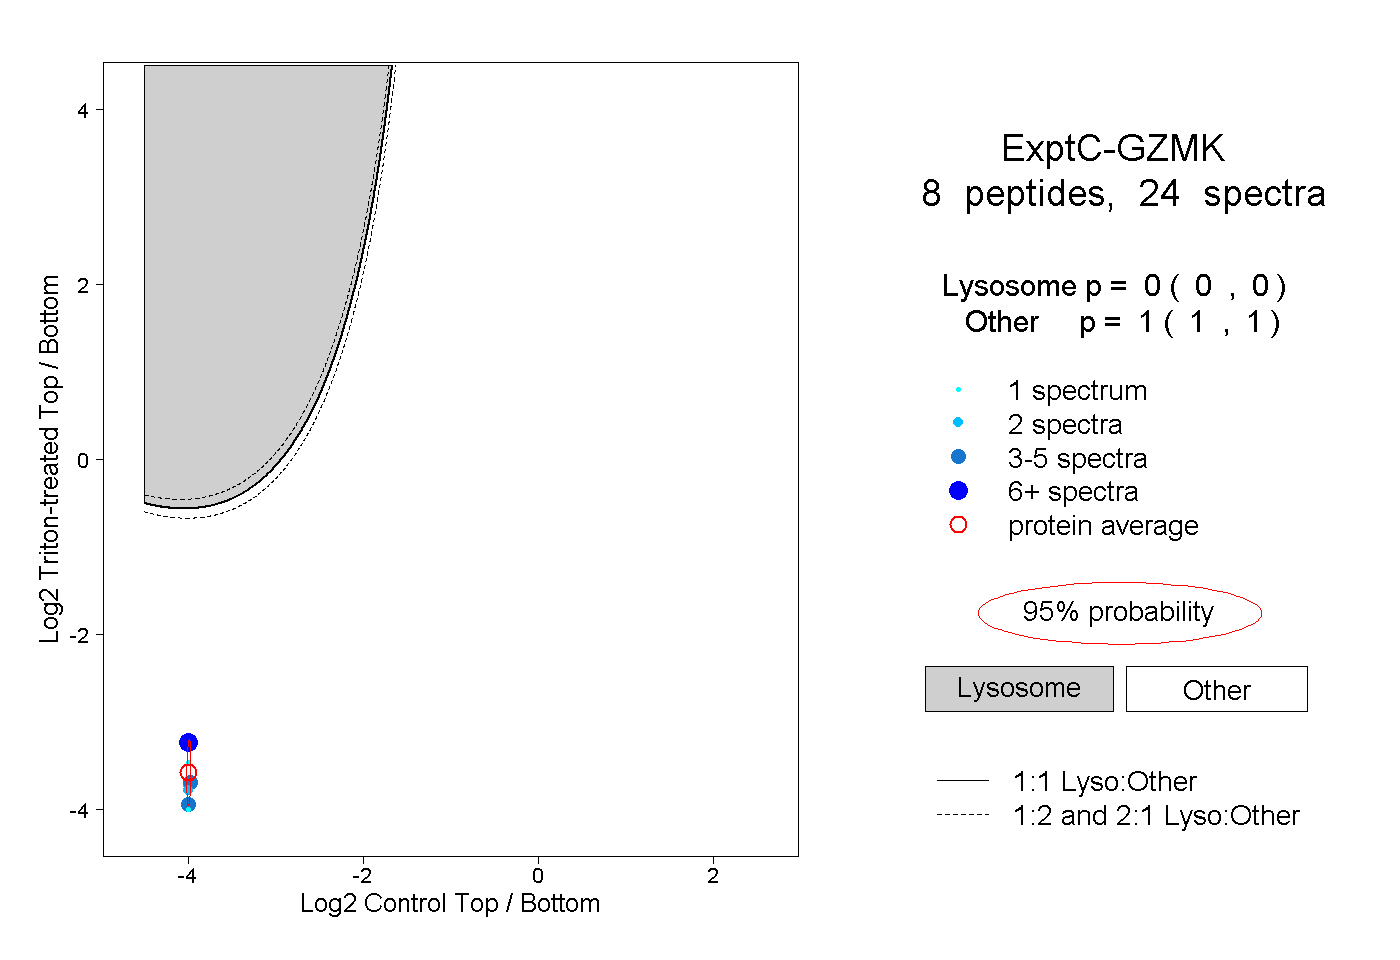
| Expt C |
8 peptides |
24 spectra |
|
0.000 0.000 | 0.000 |
1.000 1.000 | 1.000 |
| 2 spectra, YQTWIK | 0.000 | 1.000 | ||||||||
| 1 spectrum, HVQLLHLR | 0.000 | 1.000 | ||||||||
| 1 spectrum, SGTNDIMLIK | 0.000 | 1.000 | ||||||||
| 1 spectrum, CGISNKPGVYTLLTK | 0.000 | 1.000 | ||||||||
| 3 spectra, EFIPFSGFK | 0.000 | 1.000 | ||||||||
| 9 spectra, DMICAGDAR | 0.000 | 1.000 | ||||||||
| 5 spectra, TAAELNK | 0.000 | 1.000 | ||||||||
| 2 spectra, GDSGGPLICK | 0.000 | 1.000 |