 11
11peptides
spectra
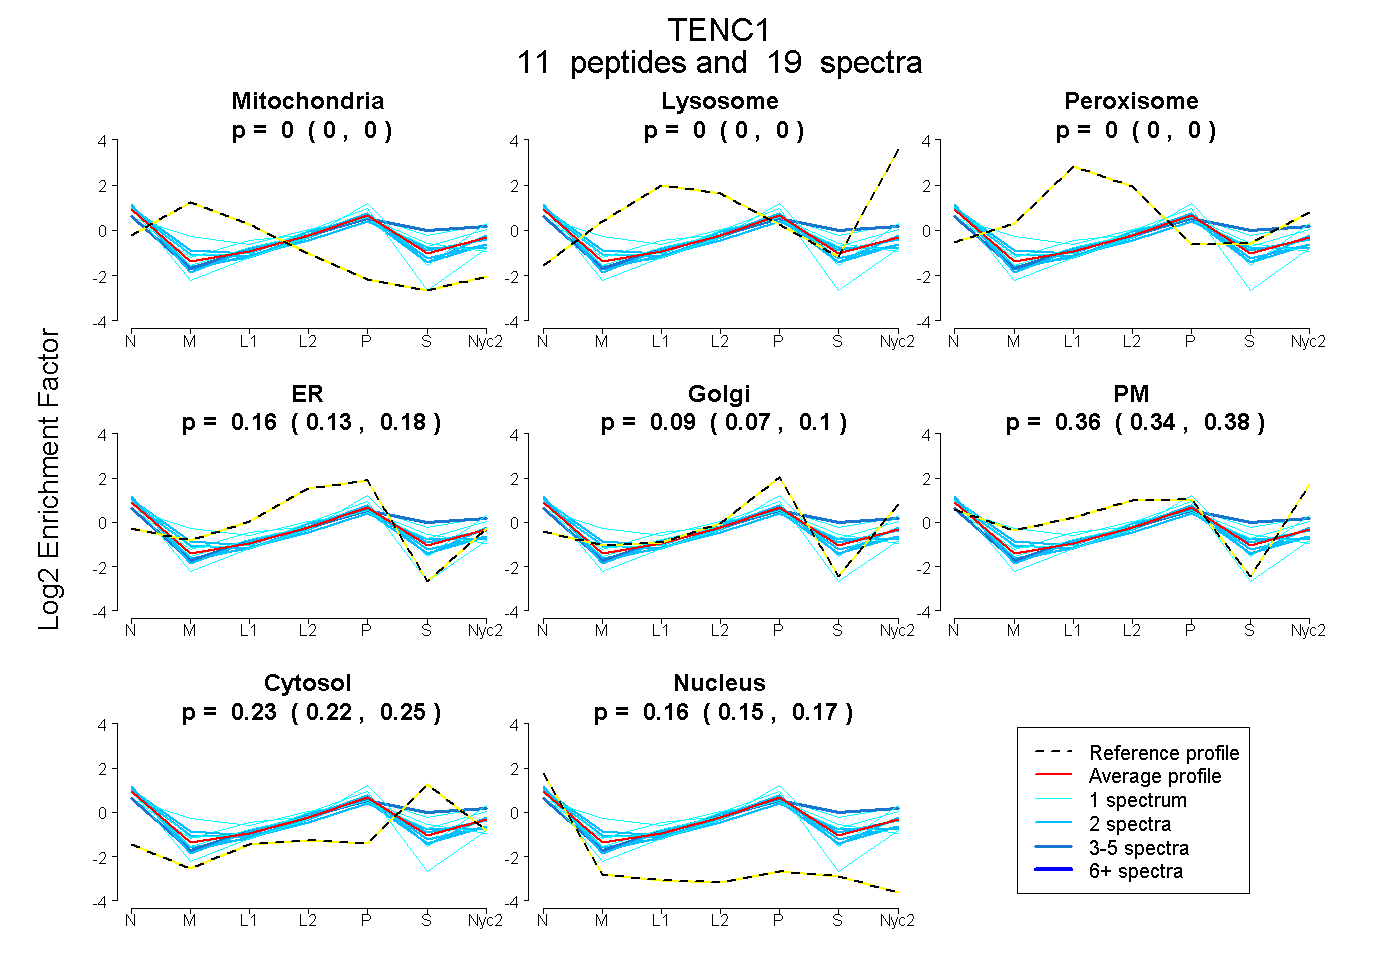
0.000 | 0.000
0.000 | 0.000
0.000 | 0.000
0.132 | 0.176
0.069 | 0.104
0.340 | 0.380
0.215 | 0.248
0.152 | 0.170
| Plot | Mito | Lyso | Perox | ER | Golgi | PM | Cytosol | Nucleus | |||||
| Expt A |
11 peptides |
19 spectra |
|
0.000 0.000 | 0.000 |
0.000 0.000 | 0.000 |
0.000 0.000 | 0.000 |
0.156 0.132 | 0.176 |
0.088 0.069 | 0.104 |
0.362 0.340 | 0.380 |
0.232 0.215 | 0.248 |
0.162 0.152 | 0.170 |
| 4 spectra, NTAPVR | 0.000 | 0.000 | 0.000 | 0.000 | 0.068 | 0.440 | 0.465 | 0.027 | ||
| 2 spectra, SPVPTTLPGLR | 0.000 | 0.000 | 0.000 | 0.135 | 0.141 | 0.371 | 0.152 | 0.200 | ||
| 2 spectra, DQLDEAWADER | 0.000 | 0.000 | 0.000 | 0.123 | 0.086 | 0.378 | 0.248 | 0.165 | ||
| 1 spectrum, SFSLDPLMER | 0.000 | 0.000 | 0.000 | 0.429 | 0.089 | 0.209 | 0.000 | 0.273 | ||
| 2 spectra, LLGGCGVASAGR | 0.000 | 0.000 | 0.000 | 0.204 | 0.147 | 0.245 | 0.180 | 0.223 | ||
| 1 spectrum, SPSLAPTQR | 0.000 | 0.000 | 0.000 | 0.000 | 0.497 | 0.229 | 0.118 | 0.156 | ||
| 1 spectrum, LCSICK | 0.106 | 0.000 | 0.000 | 0.065 | 0.000 | 0.522 | 0.288 | 0.019 | ||
| 1 spectrum, VGEEGHEGCSYAVCPEGR | 0.000 | 0.000 | 0.004 | 0.331 | 0.000 | 0.186 | 0.321 | 0.158 | ||
| 2 spectra, ILAAAFPARPDEQR | 0.000 | 0.000 | 0.000 | 0.255 | 0.000 | 0.380 | 0.145 | 0.220 | ||
| 2 spectra, GDPSEQLVR | 0.000 | 0.000 | 0.000 | 0.198 | 0.019 | 0.281 | 0.287 | 0.215 | ||
| 1 spectrum, DSHSFQGAYGLALK | 0.000 | 0.000 | 0.000 | 0.016 | 0.010 | 0.541 | 0.413 | 0.019 |
| Plot | Mito | Lyso or Perox | ER | Golgi | PM | Cytosol | Nucleus | ||||||
| Expt B |
1 peptide |
1 spectrum |
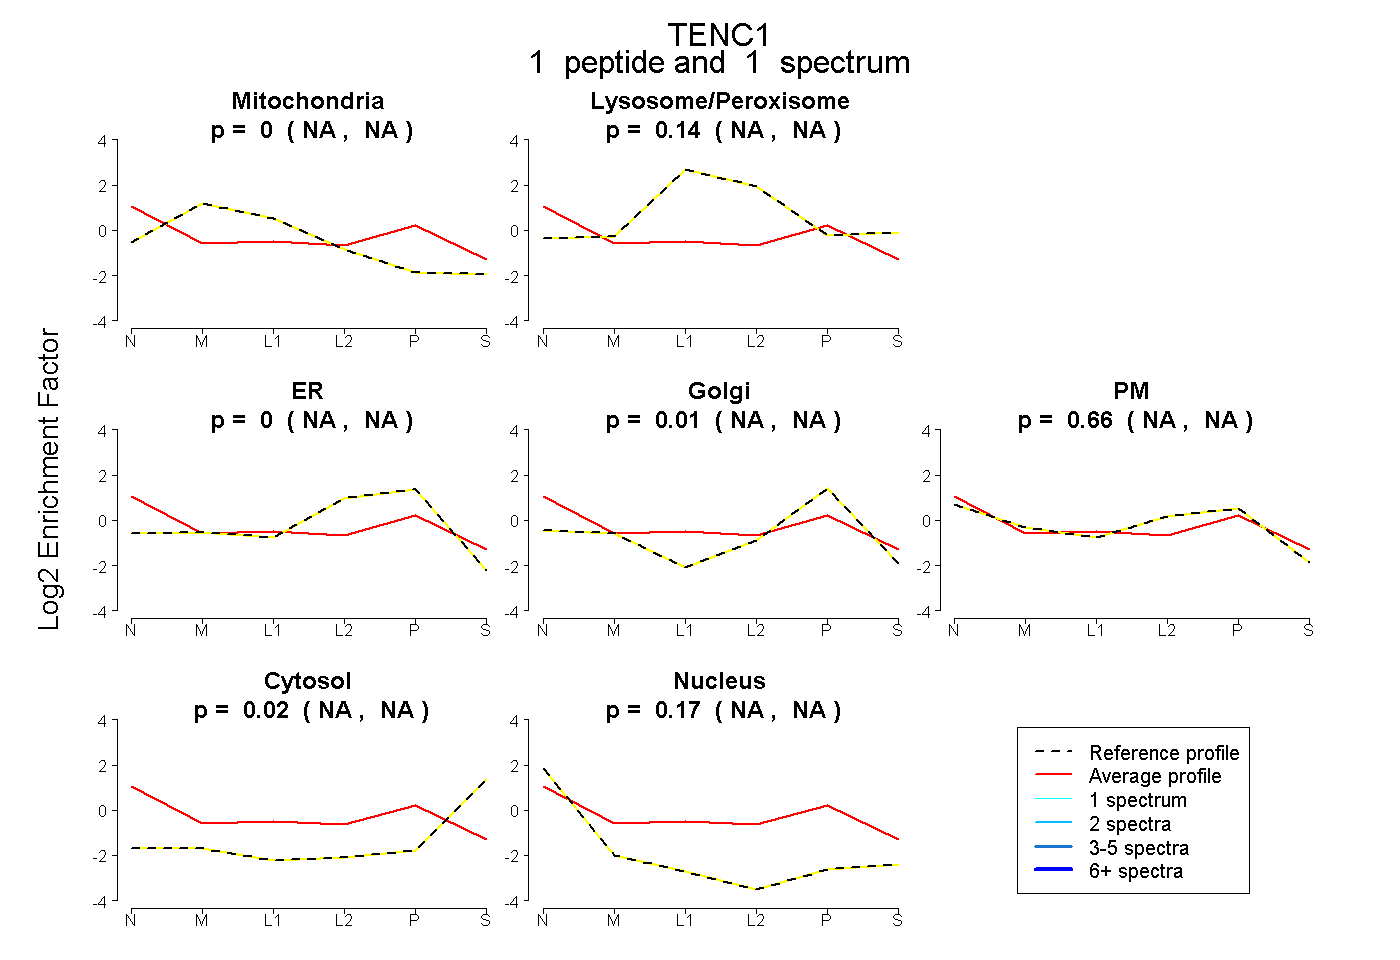 |
0.000 NA | NA |
0.139 NA | NA |
0.000 NA | NA |
0.013 NA | NA |
0.656 NA | NA |
0.020 NA | NA |
0.173 NA | NA |
|||
| Plot | Lyso | Other | |||||||||||
| Expt C |
2 peptides |
3 spectra |
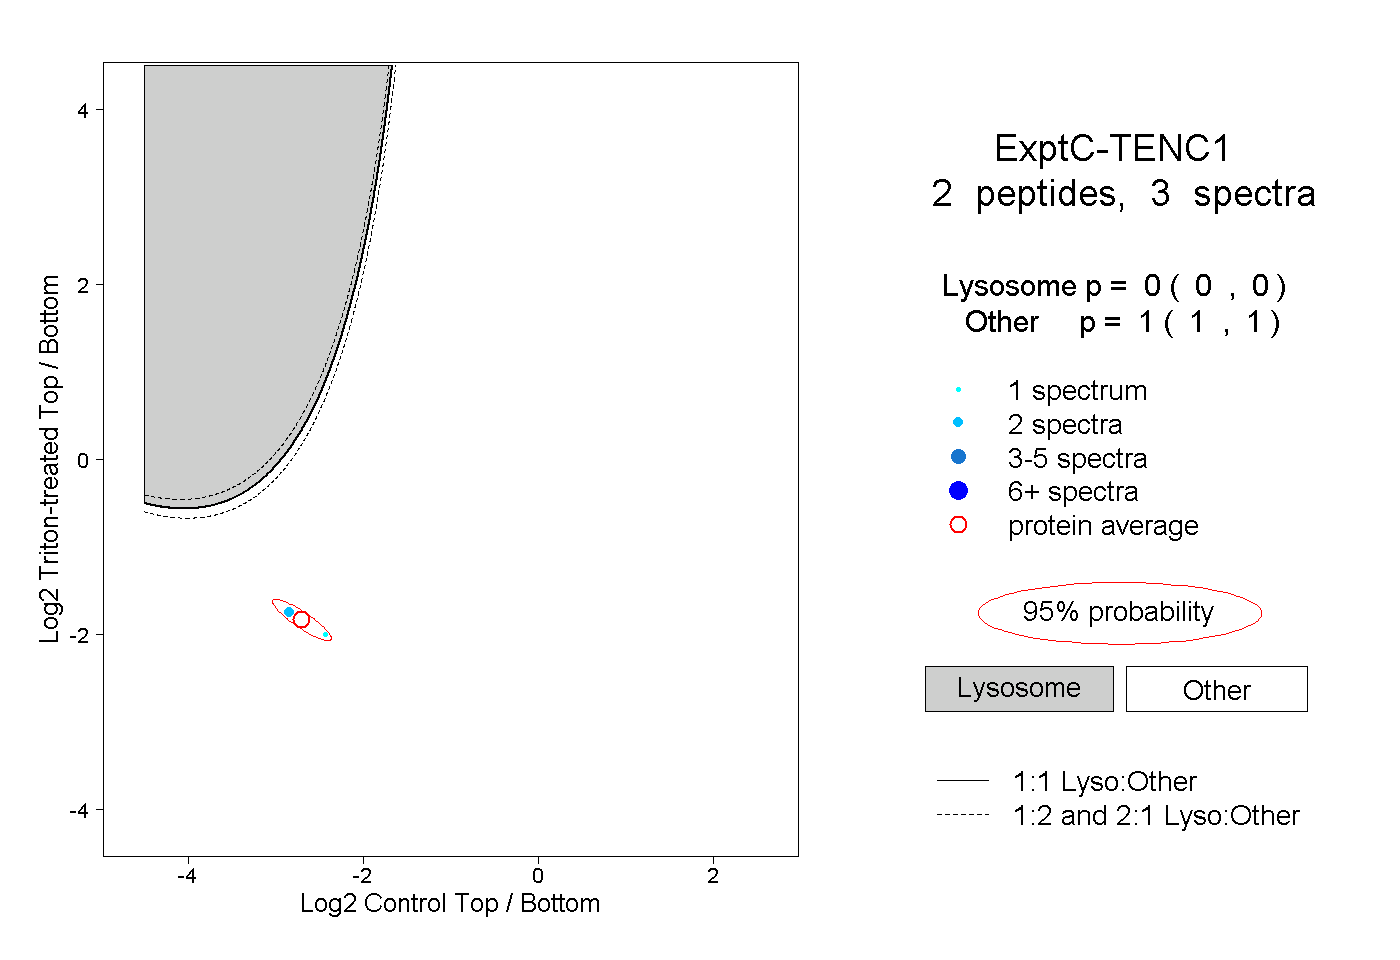 |
0.000 0.000 | 0.000 |
1.000 1.000 | 1.000 |
||||||||
| Plot | Lyso | Other | |||||||||||
| Expt D |
1 peptide |
3 spectra |
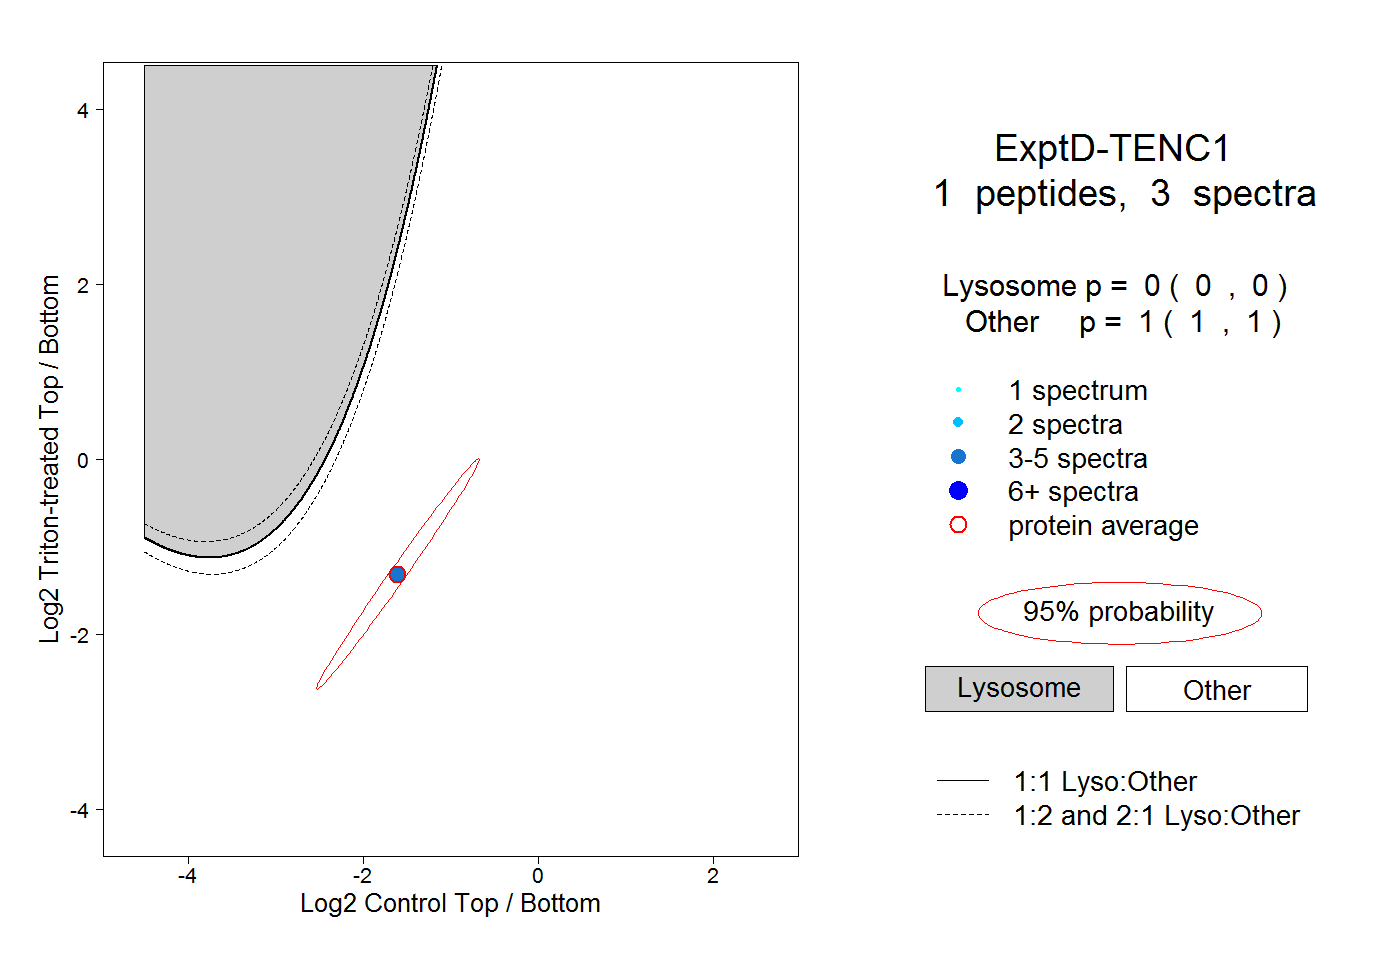 |
0.000 0.000 | 0.000 |
1.000 1.000 | 1.000 |