 7
7peptides
spectra
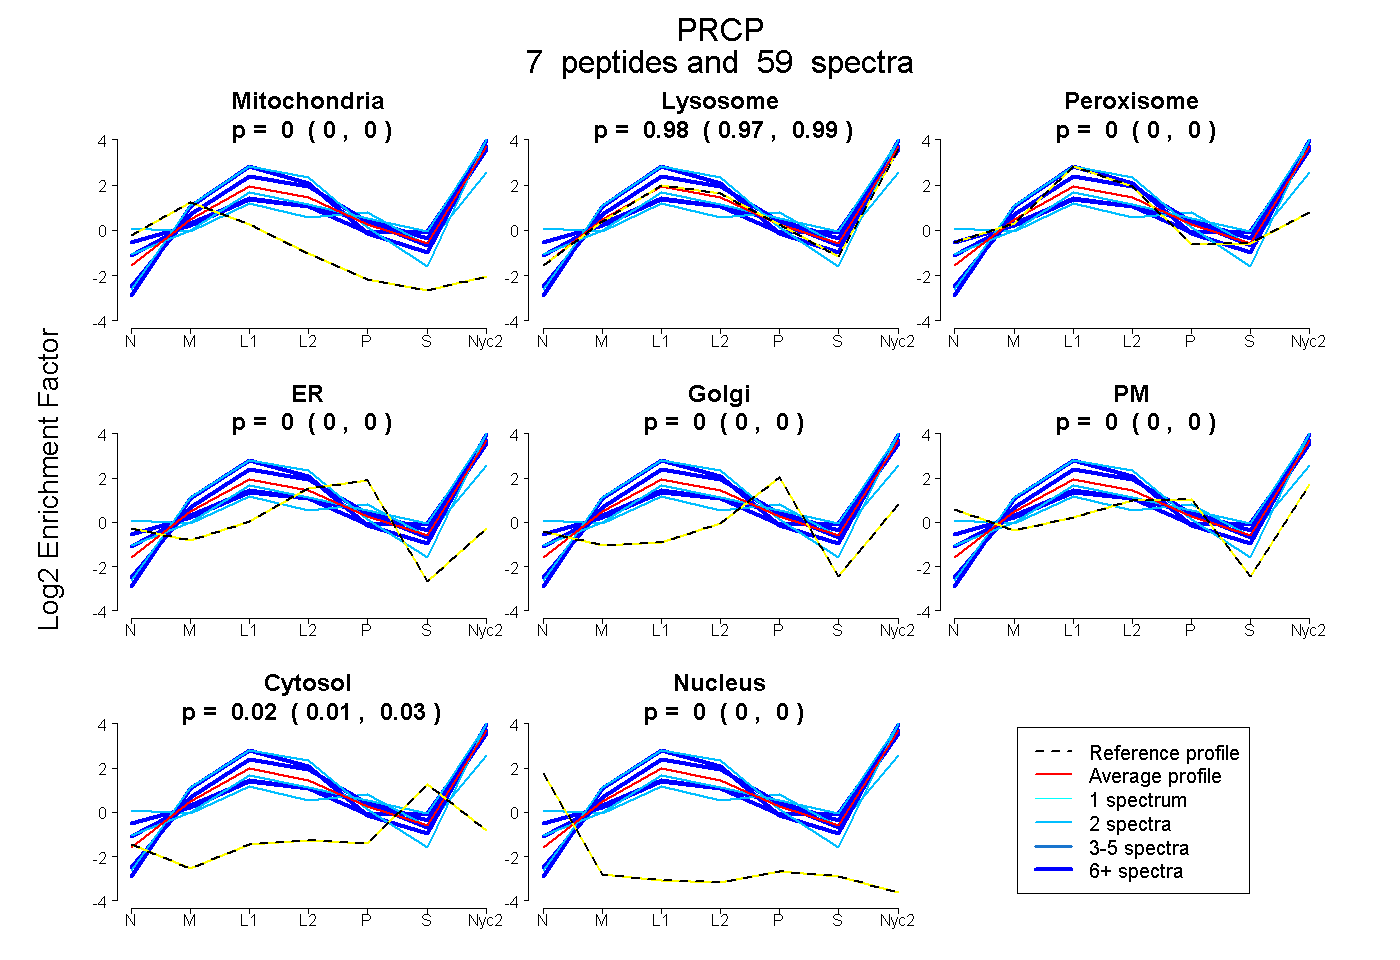
0.000 | 0.000
0.973 | 0.986
0.000 | 0.000
0.000 | 0.000
0.000 | 0.000
0.000 | 0.000
0.012 | 0.026
0.000 | 0.000
6peptides
spectra
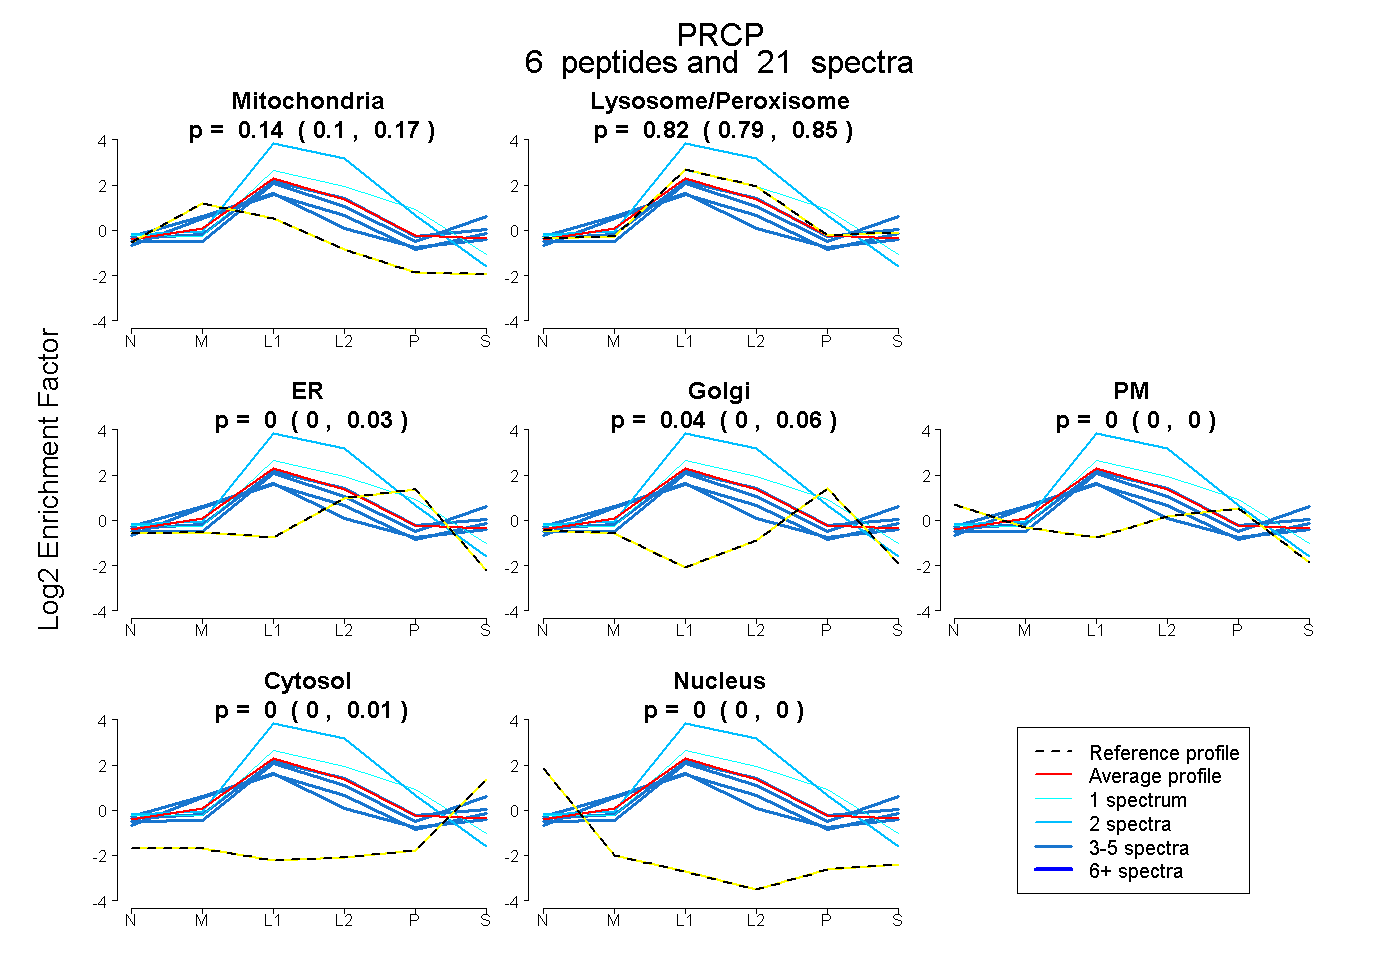
0.102 | 0.168
0.788 | 0.849
0.000 | 0.029
0.000 | 0.060
0.000 | 0.000
0.000 | 0.012
0.000 | 0.000
7peptides
spectra
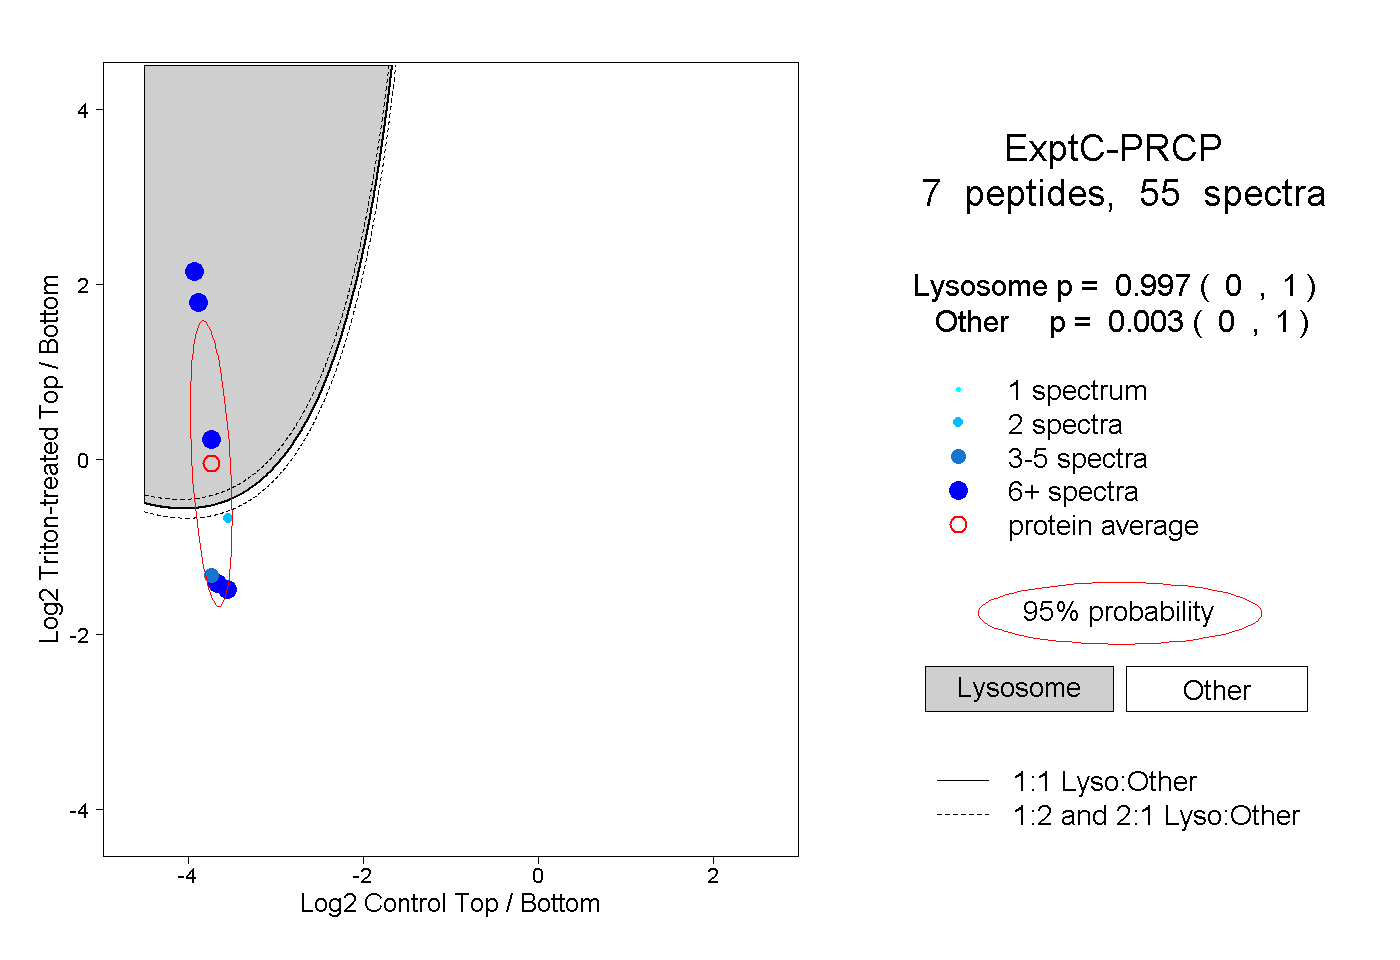
0.000 | 1.000
0.000 | 1.000
4peptides
spectra
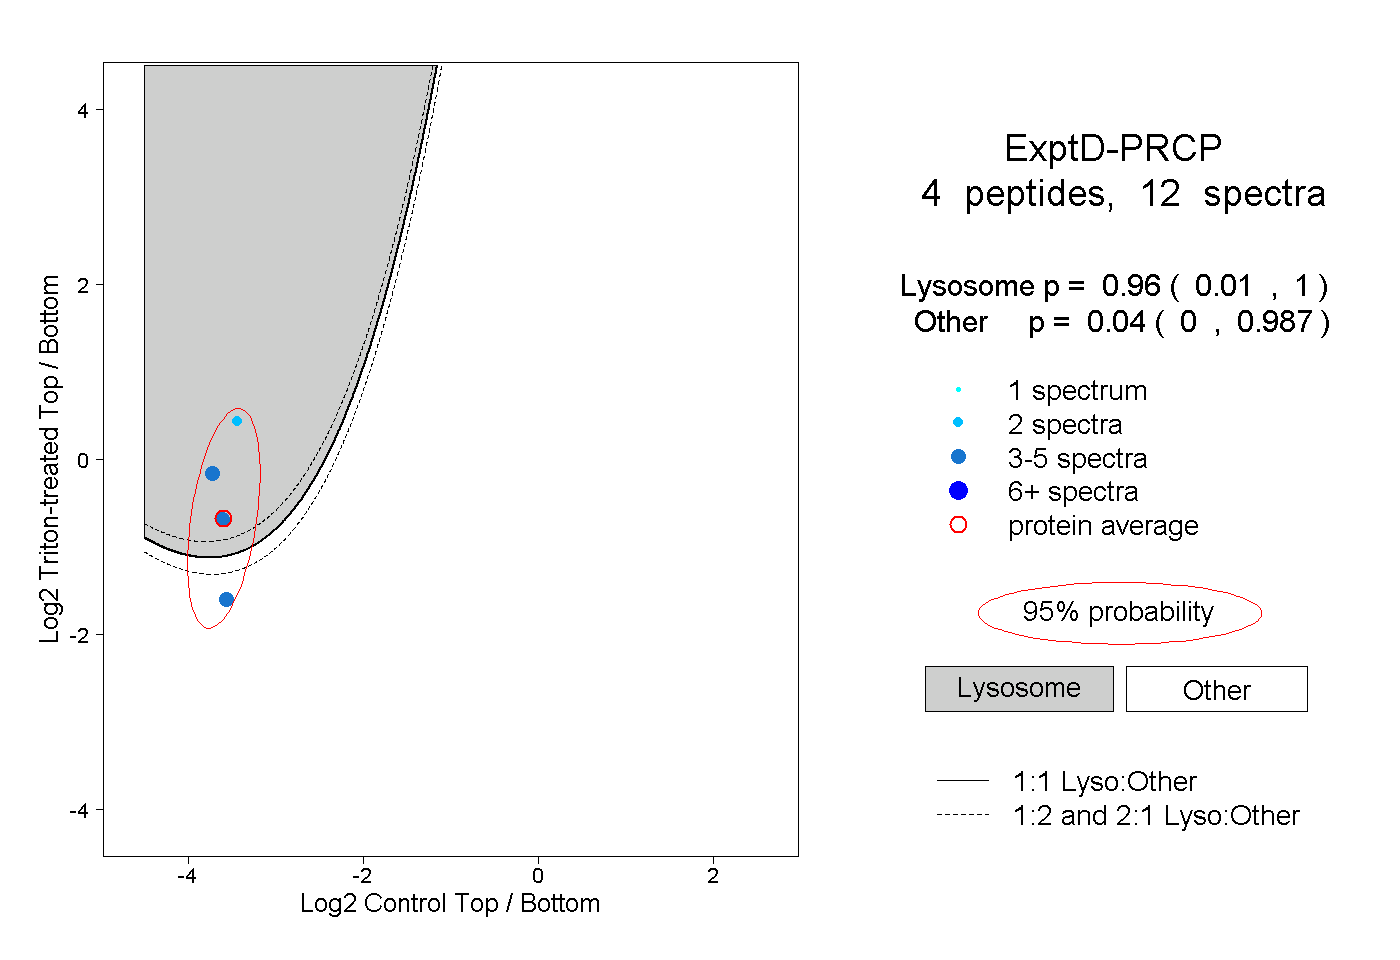
0.010 | 1.000
0.000 | 0.987