 6
6peptides
spectra
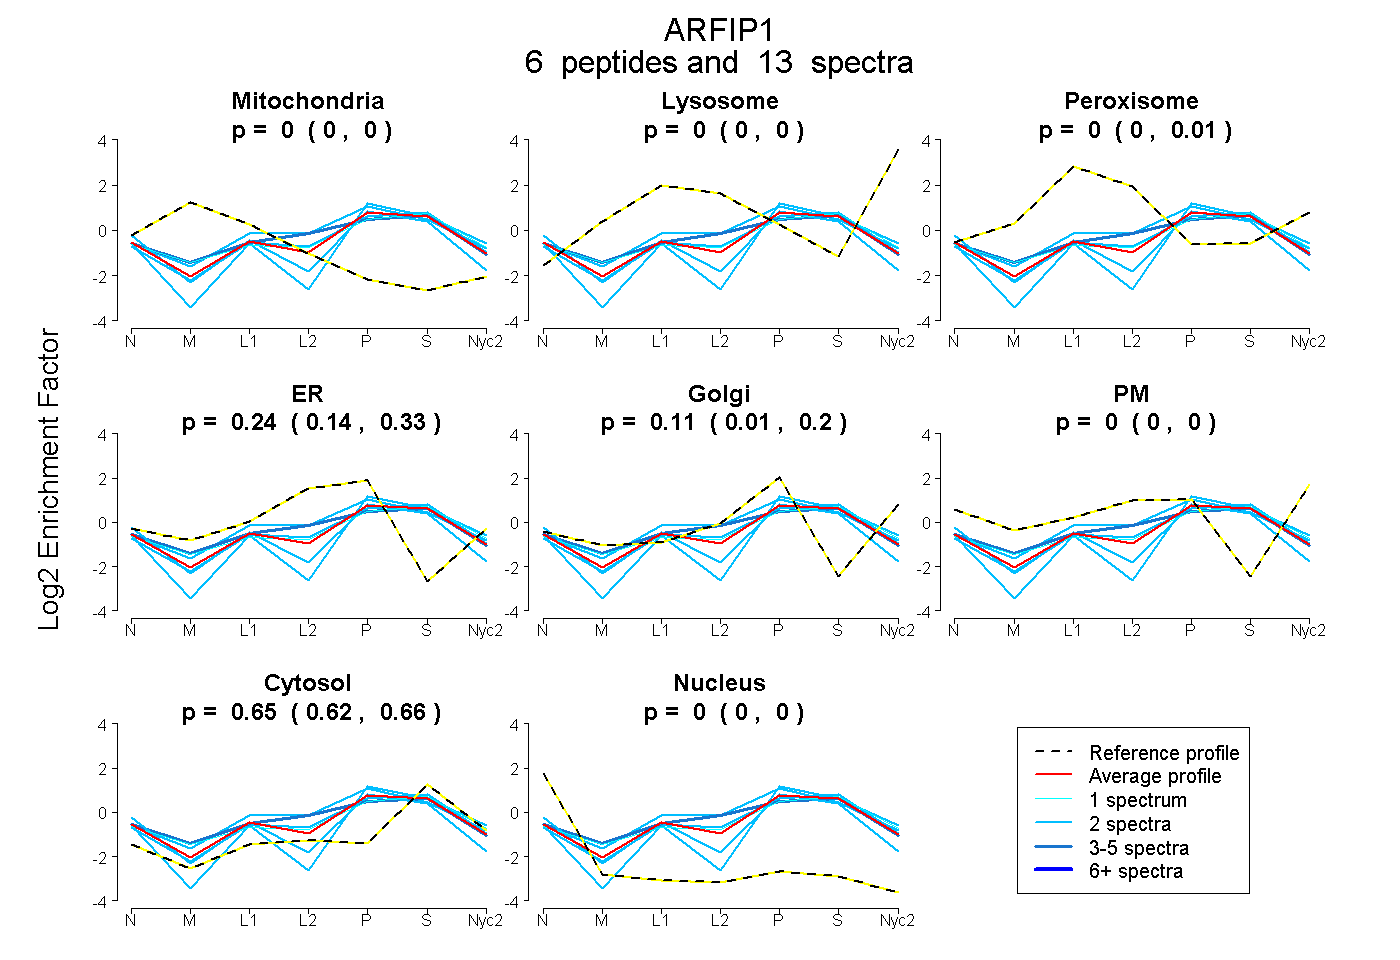
0.000 | 0.000
0.000 | 0.000
0.000 | 0.005
0.141 | 0.325
0.013 | 0.202
0.000 | 0.000
0.623 | 0.663
0.000 | 0.000
3peptides
spectra
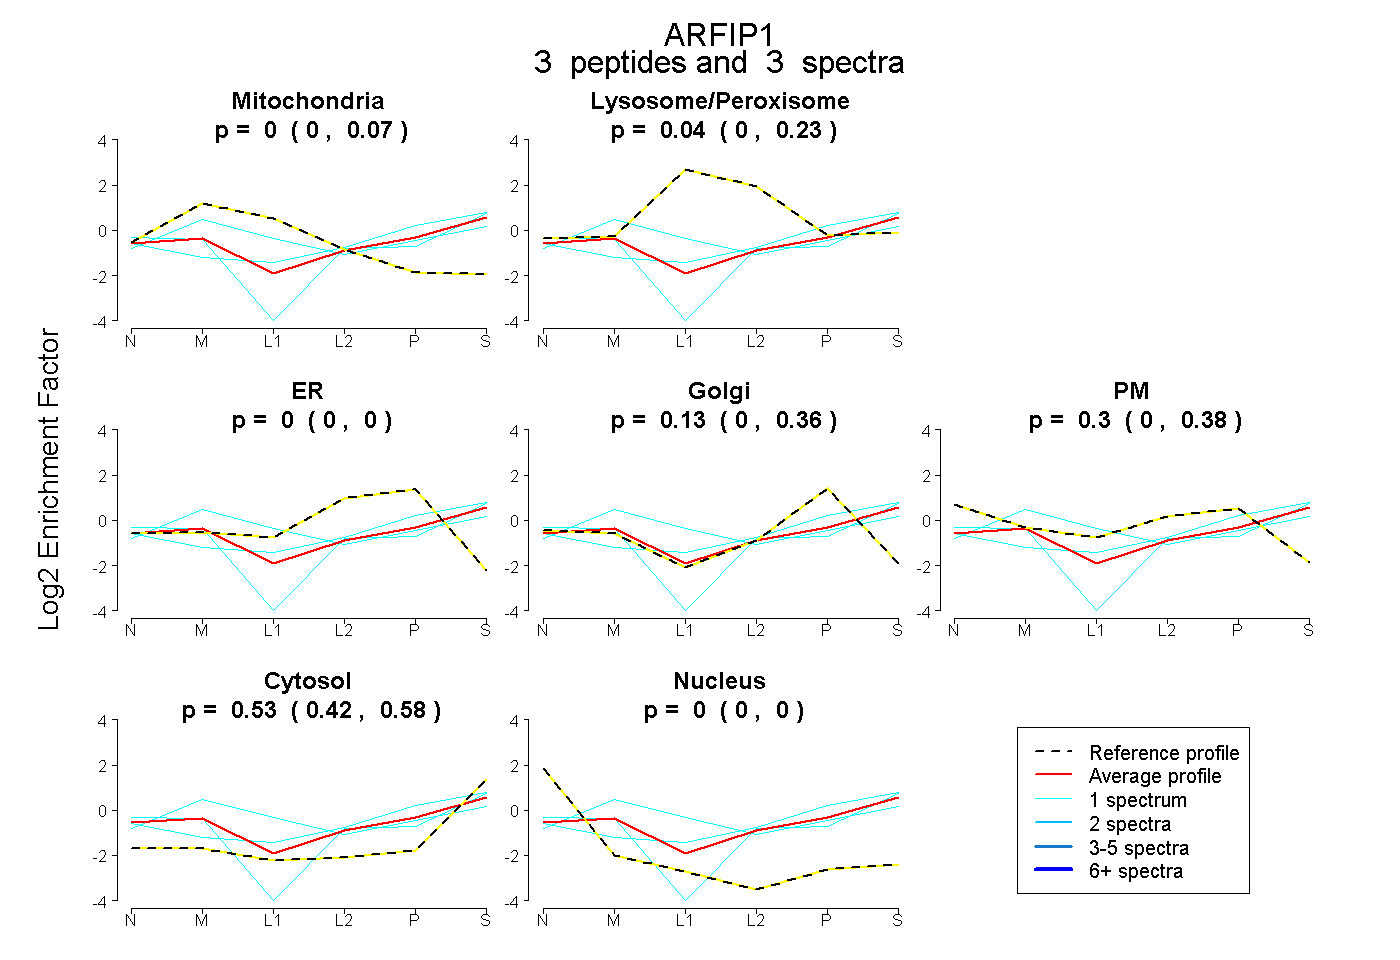
0.000 | 0.071
0.000 | 0.231
0.000 | 0.000
0.000 | 0.357
0.000 | 0.380
0.425 | 0.582
0.000 | 0.000
4peptides
spectra
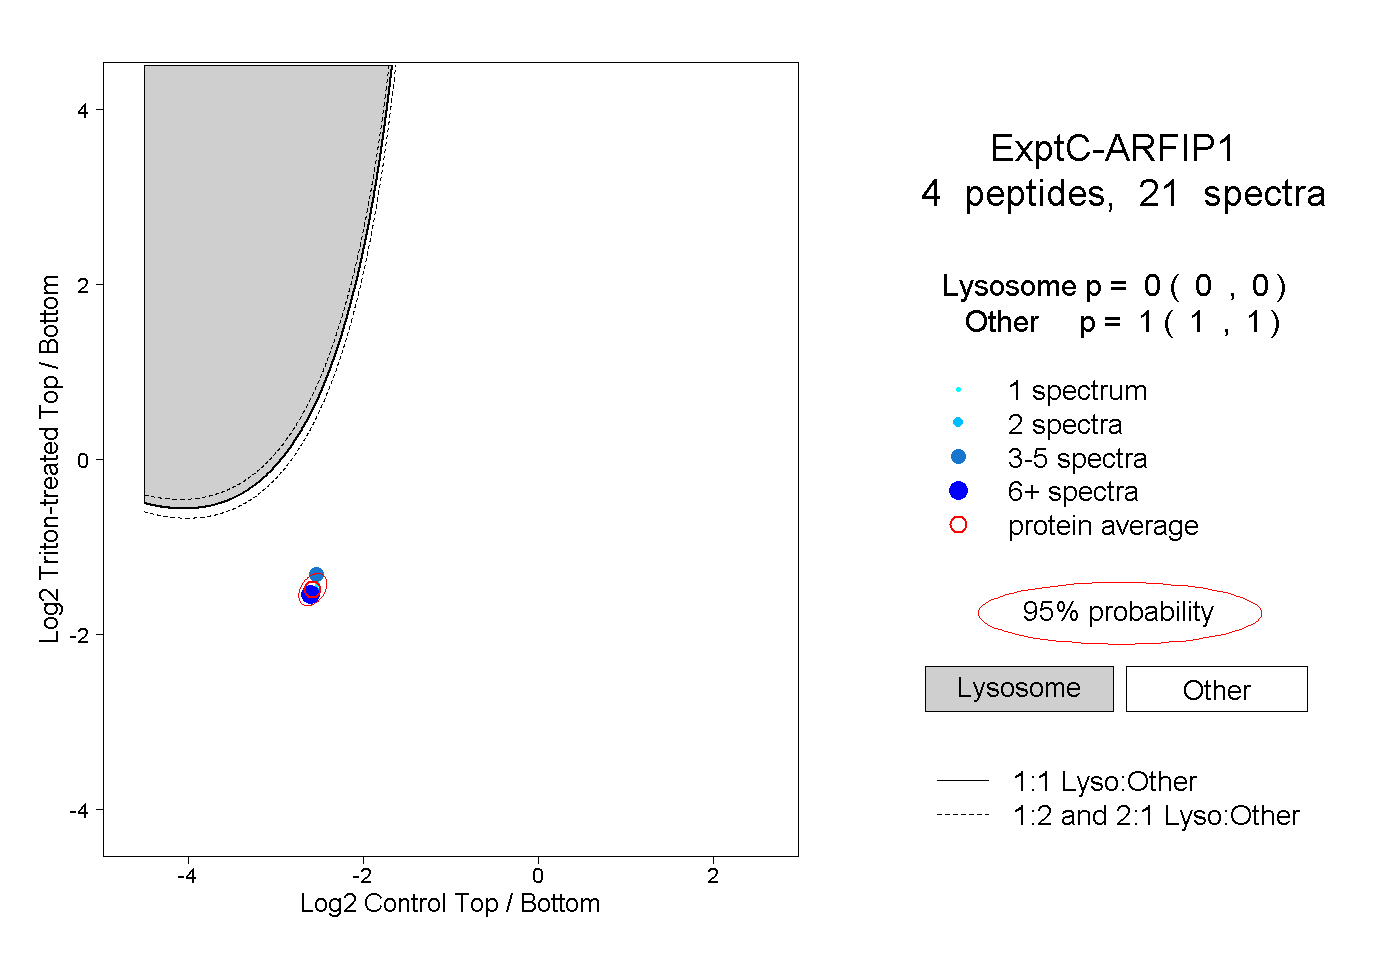
0.000 | 0.000
1.000 | 1.000