 5
5peptides
spectra
0.000 | 0.000
0.000 | 0.000
0.000 | 0.000
0.000 | 0.122
0.069 | 0.261
0.000 | 0.000
0.121 | 0.169
0.585 | 0.661
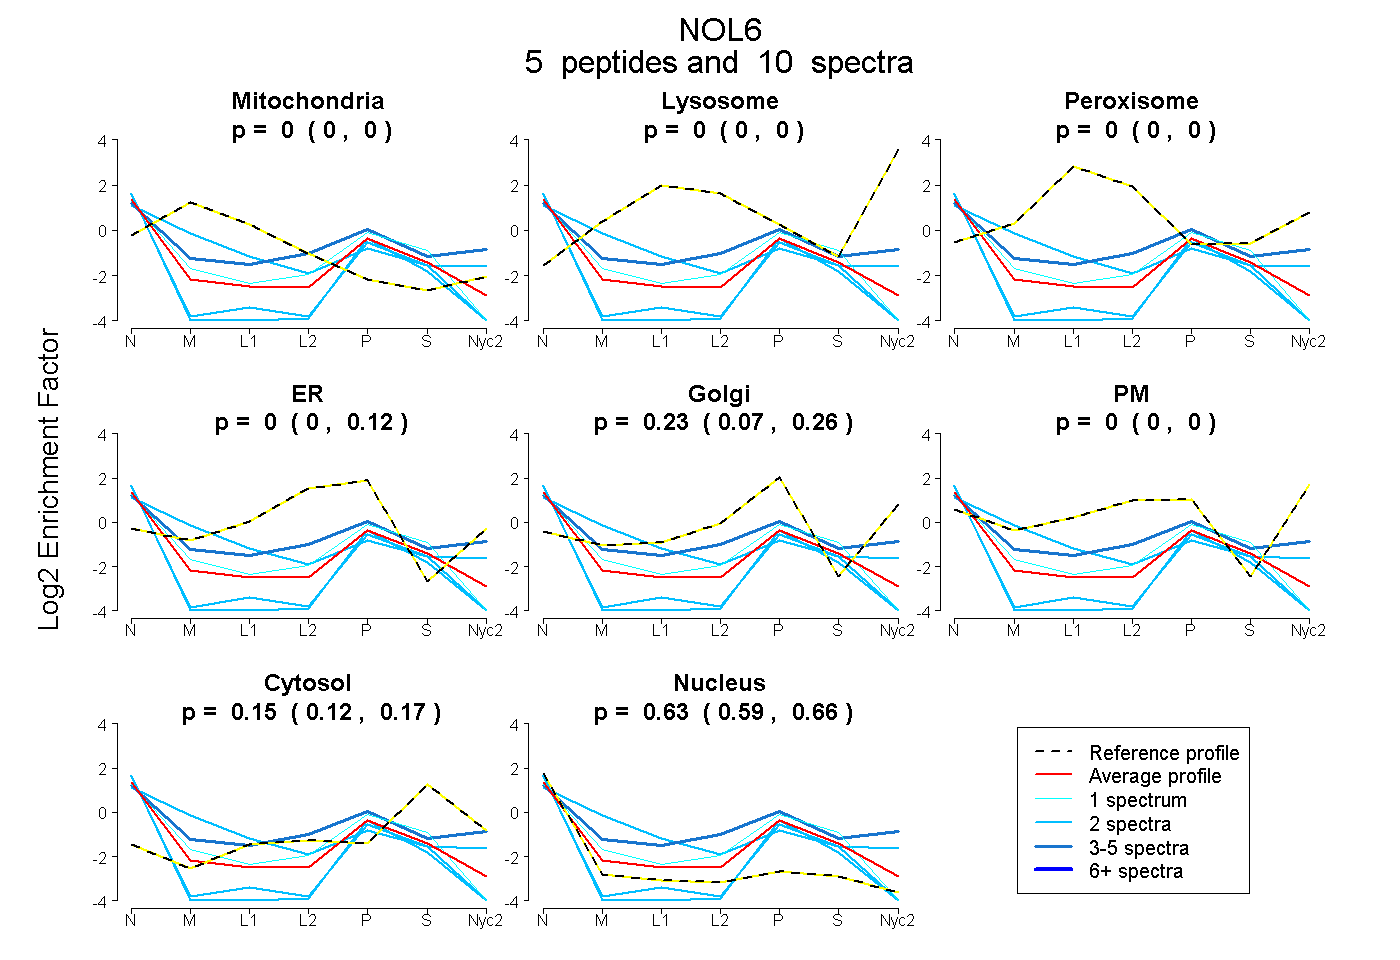
| Plot | Mito | Lyso | Perox | ER | Golgi | PM | Cytosol | Nucleus | |||||
| Expt A |
5 peptides |
10 spectra |
|
0.000 0.000 | 0.000 |
0.000 0.000 | 0.000 |
0.000 0.000 | 0.000 |
0.000 0.000 | 0.122 |
0.228 0.069 | 0.261 |
0.000 0.000 | 0.000 |
0.146 0.121 | 0.169 |
0.626 0.585 | 0.661 |
| 2 spectra, GGFVFR | 0.000 | 0.000 | 0.000 | 0.000 | 0.000 | 0.000 | 0.134 | 0.866 | ||
| 2 spectra, AAFQLR | 0.354 | 0.000 | 0.000 | 0.000 | 0.127 | 0.121 | 0.100 | 0.298 | ||
| 1 spectrum, VPLHQVPYAVK | 0.000 | 0.000 | 0.000 | 0.212 | 0.000 | 0.000 | 0.183 | 0.605 | ||
| 3 spectra, LAEVLTQQHR | 0.000 | 0.000 | 0.000 | 0.000 | 0.128 | 0.358 | 0.195 | 0.319 | ||
| 2 spectra, GPAPAGQQQR | 0.000 | 0.000 | 0.000 | 0.000 | 0.015 | 0.000 | 0.069 | 0.916 |