 5
5peptides
spectra

0.000 | 0.159
0.000 | 0.110
0.000 | 0.109
0.339 | 0.682
0.000 | 0.227
0.000 | 0.000
0.146 | 0.304
0.000 | 0.000
2peptides
spectra
NA | NA
NA | NA
NA | NA
NA | NA
NA | NA
NA | NA
NA | NA
| Plot | Mito | Lyso | Perox | ER | Golgi | PM | Cytosol | Nucleus | |||||
| Expt A |
5 peptides |
6 spectra |
|
0.090 0.000 | 0.159 |
0.040 0.000 | 0.110 |
0.000 0.000 | 0.109 |
0.623 0.339 | 0.682 |
0.000 0.000 | 0.227 |
0.000 0.000 | 0.000 |
0.247 0.146 | 0.304 |
0.000 0.000 | 0.000 |
||
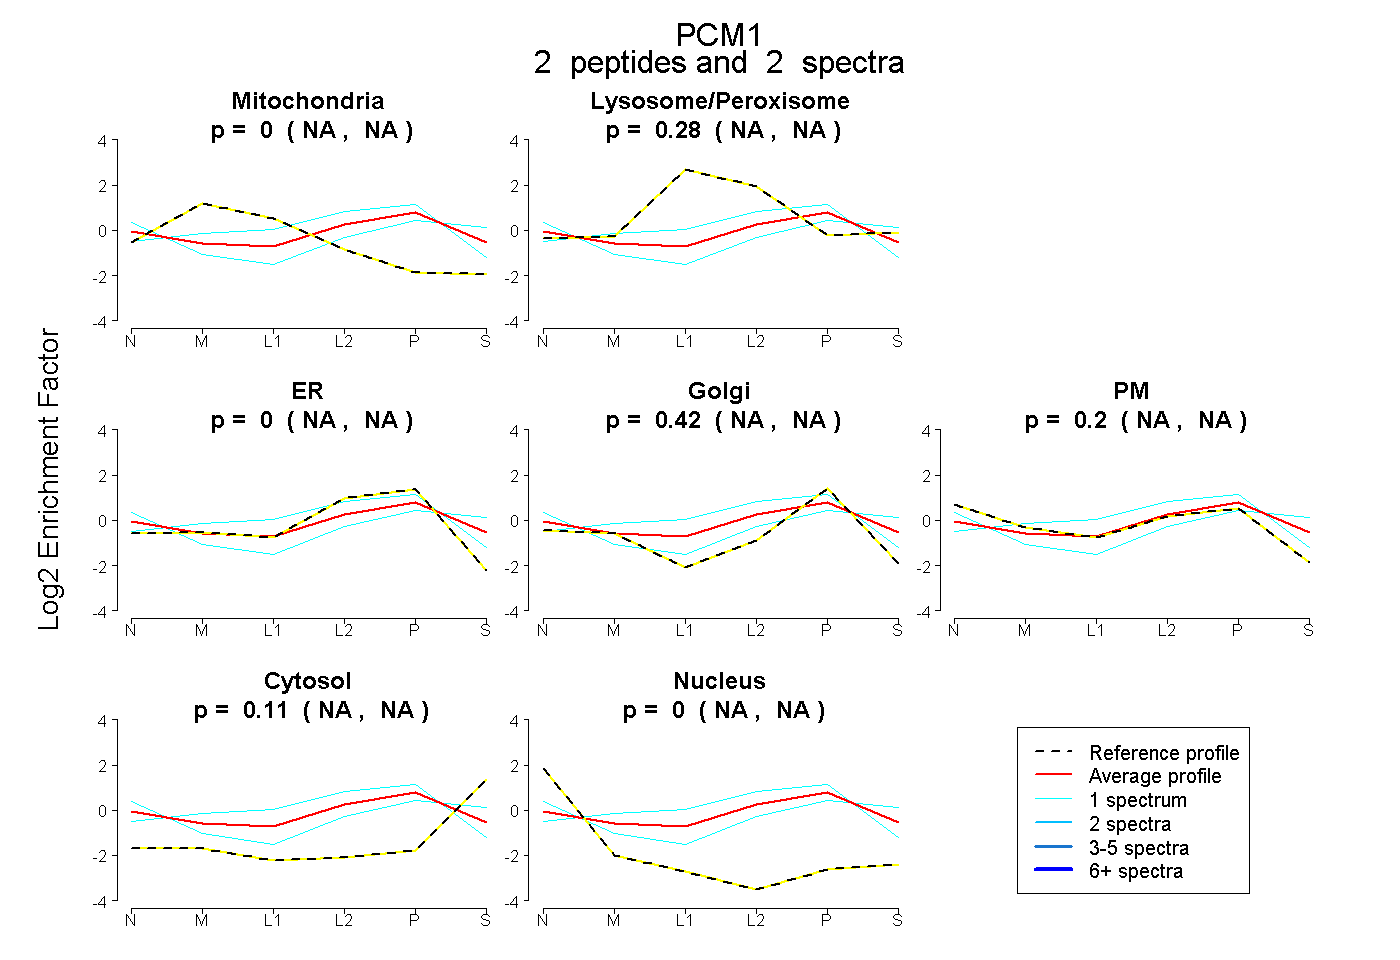
| Plot | Mito | Lyso or Perox | ER | Golgi | PM | Cytosol | Nucleus | ||||||
| Expt B |
2 peptides |
2 spectra |
|
0.000 NA | NA |
0.284 NA | NA |
0.000 NA | NA |
0.415 NA | NA |
0.196 NA | NA |
0.105 NA | NA |
0.000 NA | NA |
| 1 spectrum, QLEALMAEHQR | 0.000 | 0.032 | 0.000 | 0.049 | 0.583 | 0.336 | 0.000 | |||
| 1 spectrum, VPHTFPHSR | 0.000 | 0.345 | 0.370 | 0.285 | 0.000 | 0.000 | 0.000 |