6
6peptides
spectra
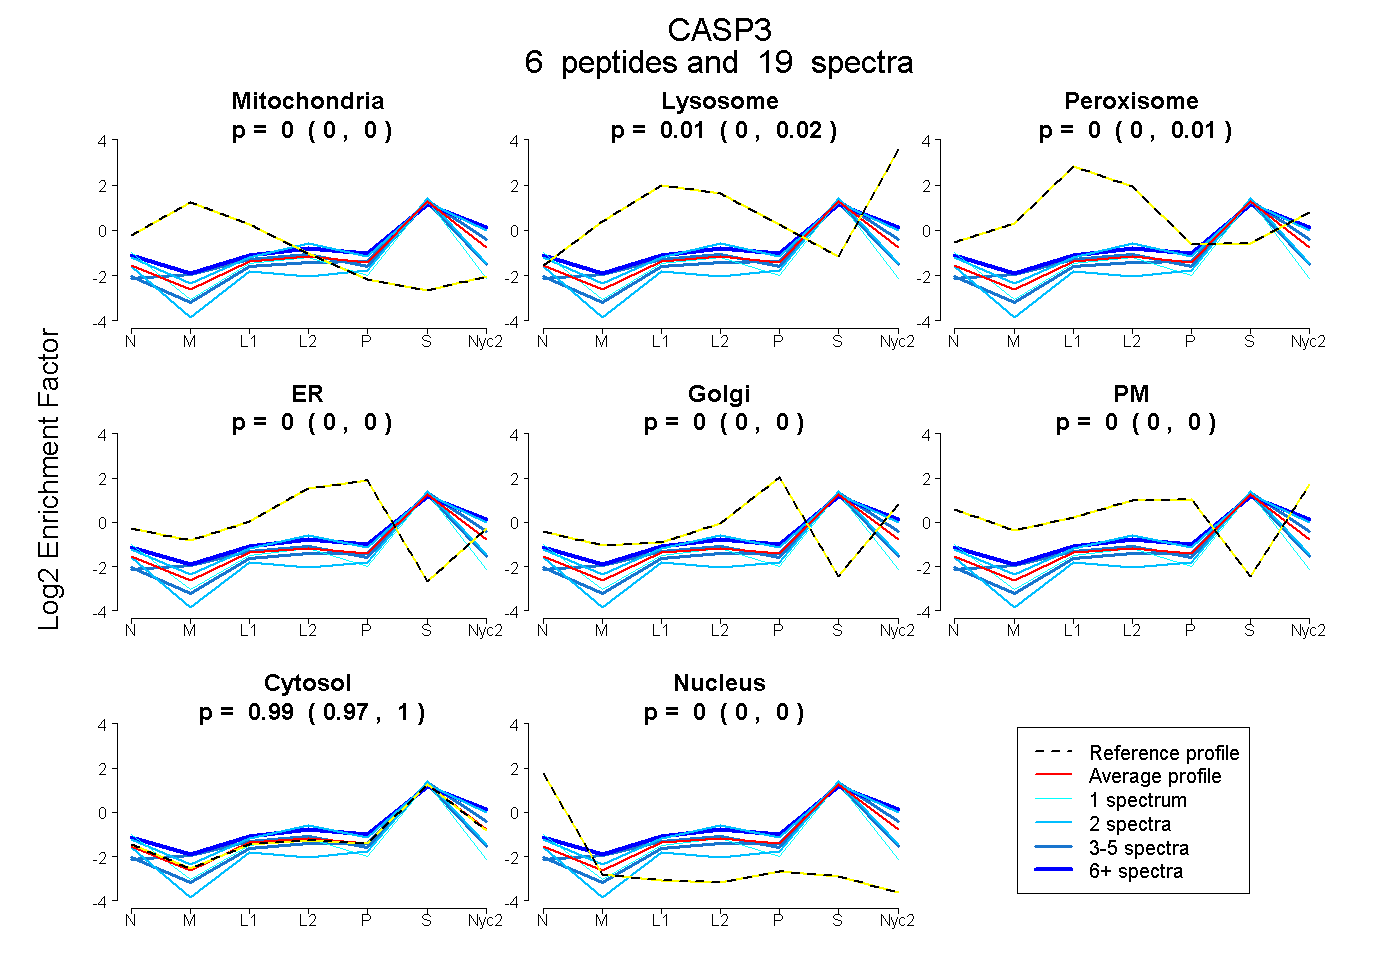
0.000 | 0.000
0.000 | 0.025
0.000 | 0.013
0.000 | 0.000
0.000 | 0.000
0.000 | 0.000
0.972 | 1.000
0.000 | 0.000
4peptides
spectra
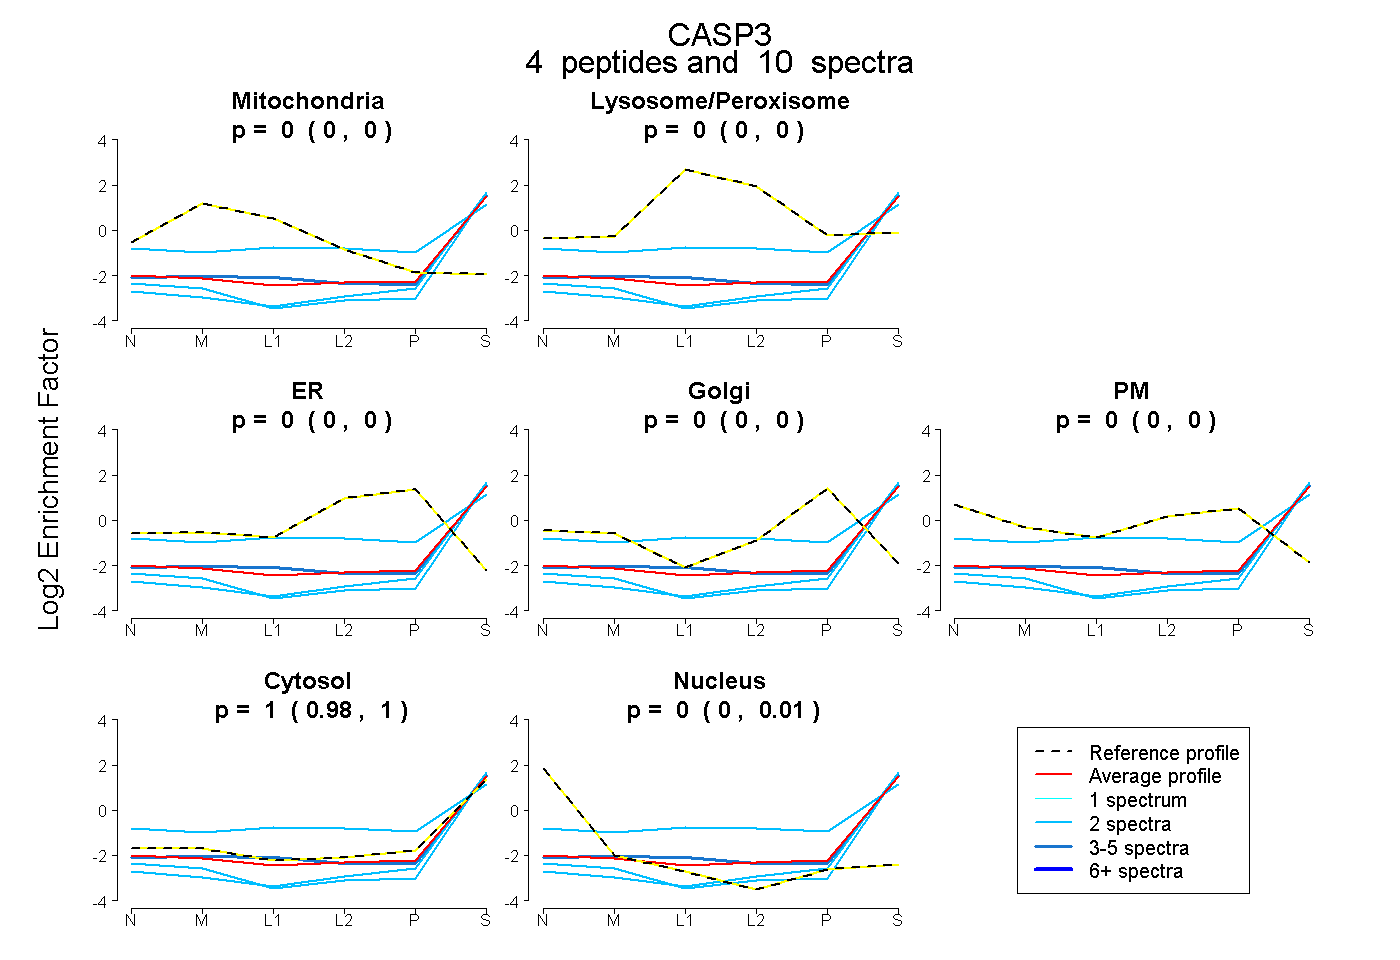
0.000 | 0.000
0.000 | 0.000
0.000 | 0.000
0.000 | 0.000
0.000 | 0.000
0.980 | 1.000
0.000 | 0.014
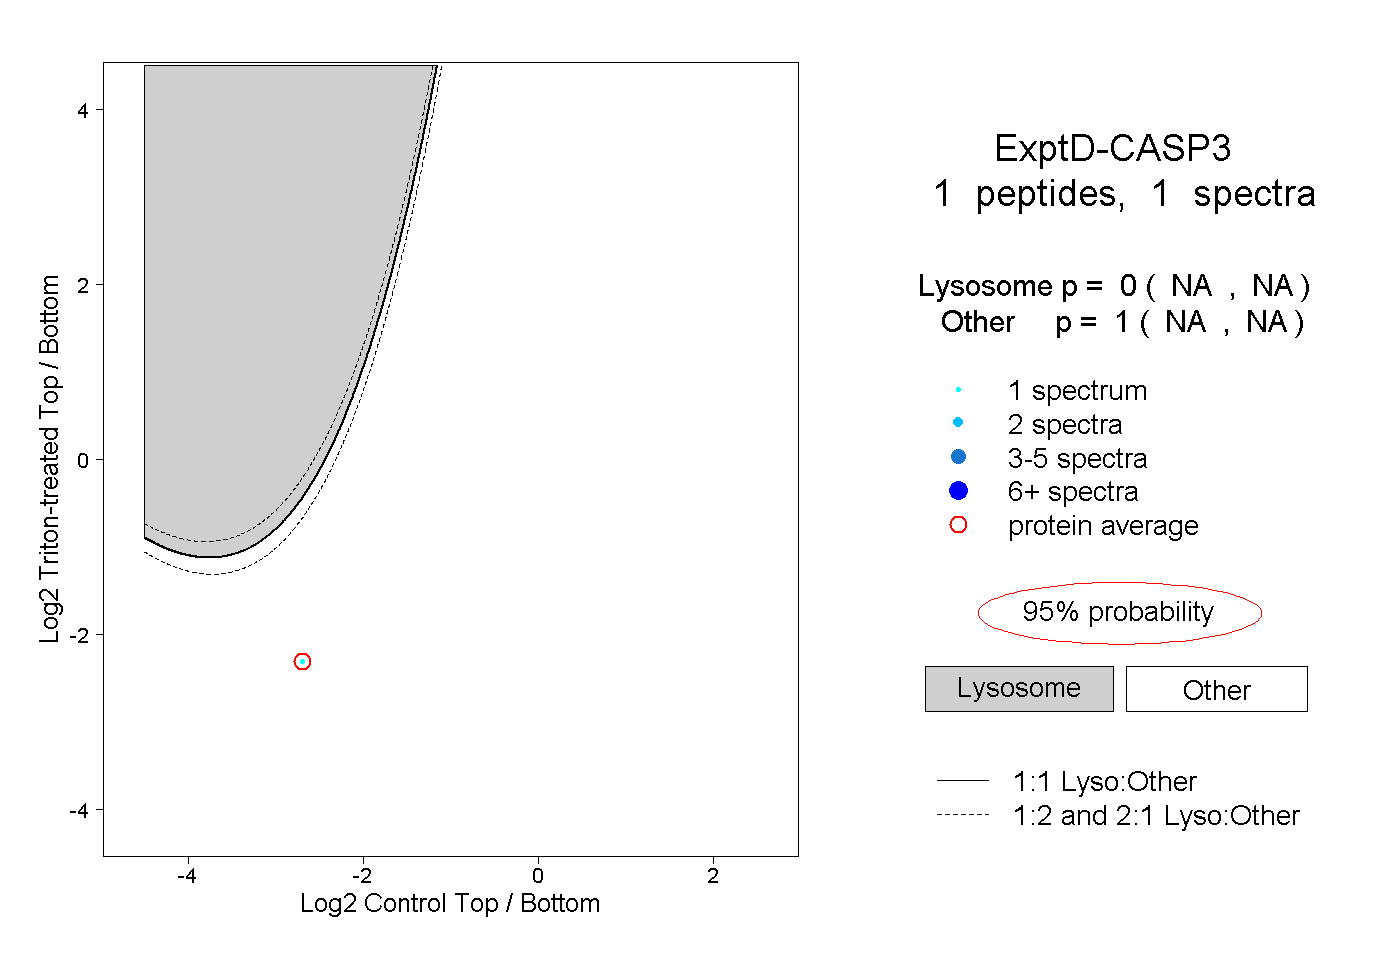
7peptides
spectra
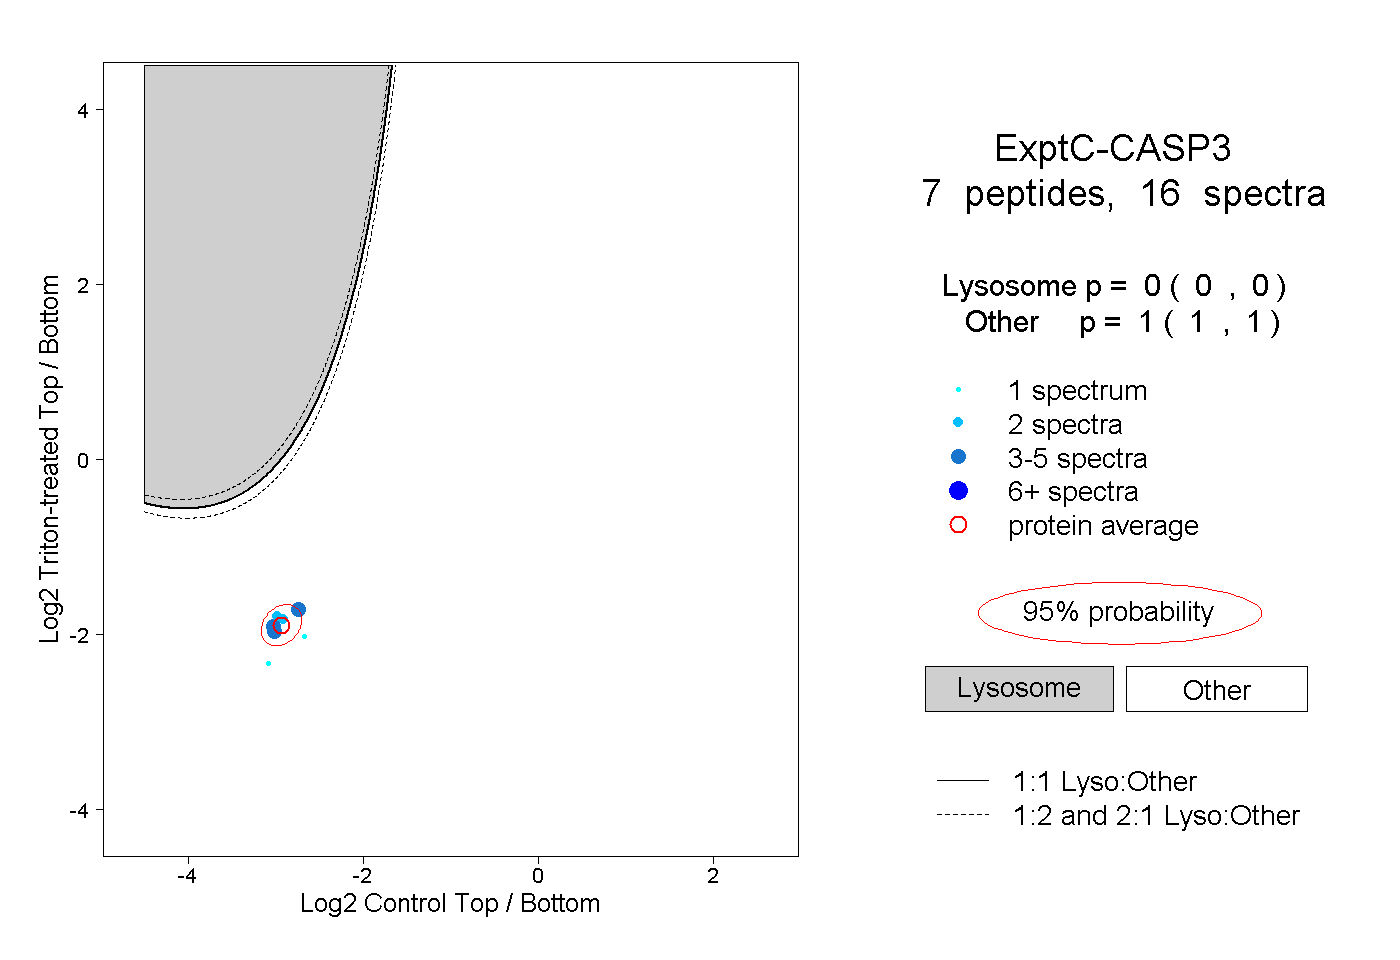
0.000 | 0.000
1.000 | 1.000