 6
6peptides
spectra
0.000 | 0.000
0.000 | 0.025
0.000 | 0.013
0.000 | 0.000
0.000 | 0.000
0.000 | 0.000
0.972 | 1.000
0.000 | 0.000
| Plot | Mito | Lyso | Perox | ER | Golgi | PM | Cytosol | Nucleus | |||||
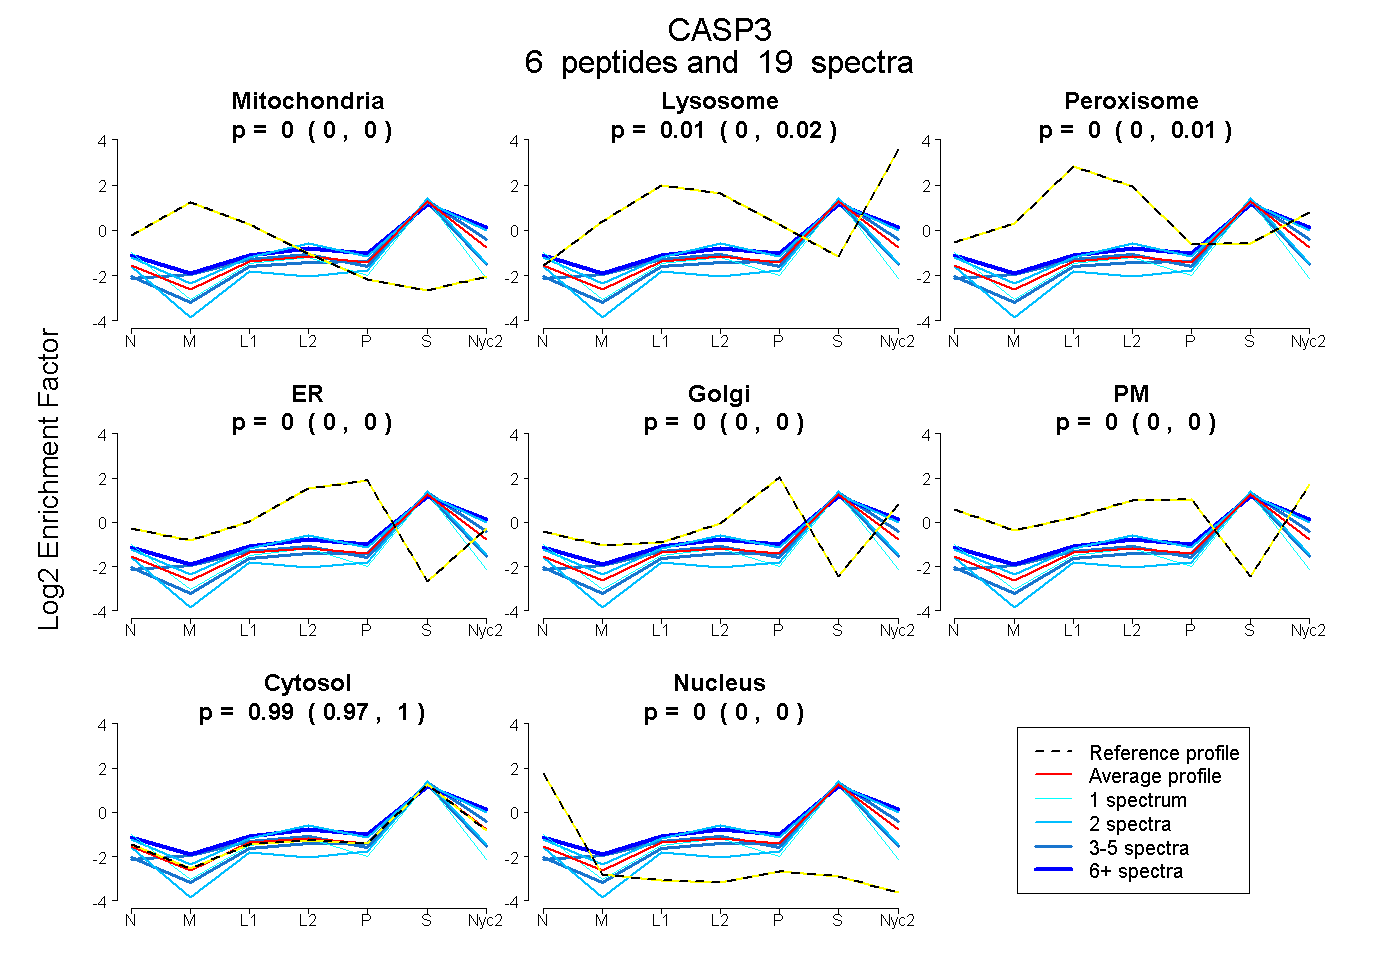
| Expt A |
6 peptides |
19 spectra |
|
0.000 0.000 | 0.000 |
0.011 0.000 | 0.025 |
0.000 0.000 | 0.013 |
0.000 0.000 | 0.000 |
0.000 0.000 | 0.000 |
0.000 0.000 | 0.000 |
0.989 0.972 | 1.000 |
0.000 0.000 | 0.000 |
| 2 spectra, SINNFETK | 0.000 | 0.000 | 0.000 | 0.000 | 0.000 | 0.000 | 0.920 | 0.080 | ||
| 3 spectra, LEFMHILTR | 0.077 | 0.000 | 0.000 | 0.000 | 0.000 | 0.000 | 0.923 | 0.000 | ||
| 1 spectrum, QIPCIVSMLTK | 0.000 | 0.000 | 0.000 | 0.000 | 0.000 | 0.000 | 0.872 | 0.128 | ||
| 2 spectra, NGTDVDAANLR | 0.000 | 0.133 | 0.000 | 0.000 | 0.000 | 0.000 | 0.867 | 0.000 | ||
| 7 spectra, LTSFFR | 0.000 | 0.153 | 0.000 | 0.000 | 0.000 | 0.021 | 0.826 | 0.000 | ||
| 4 spectra, EEIMELMDSVSK | 0.000 | 0.000 | 0.000 | 0.000 | 0.000 | 0.000 | 1.000 | 0.000 |
| Plot | Mito | Lyso or Perox | ER | Golgi | PM | Cytosol | Nucleus | ||||||
| Expt B |
4 peptides |
10 spectra |
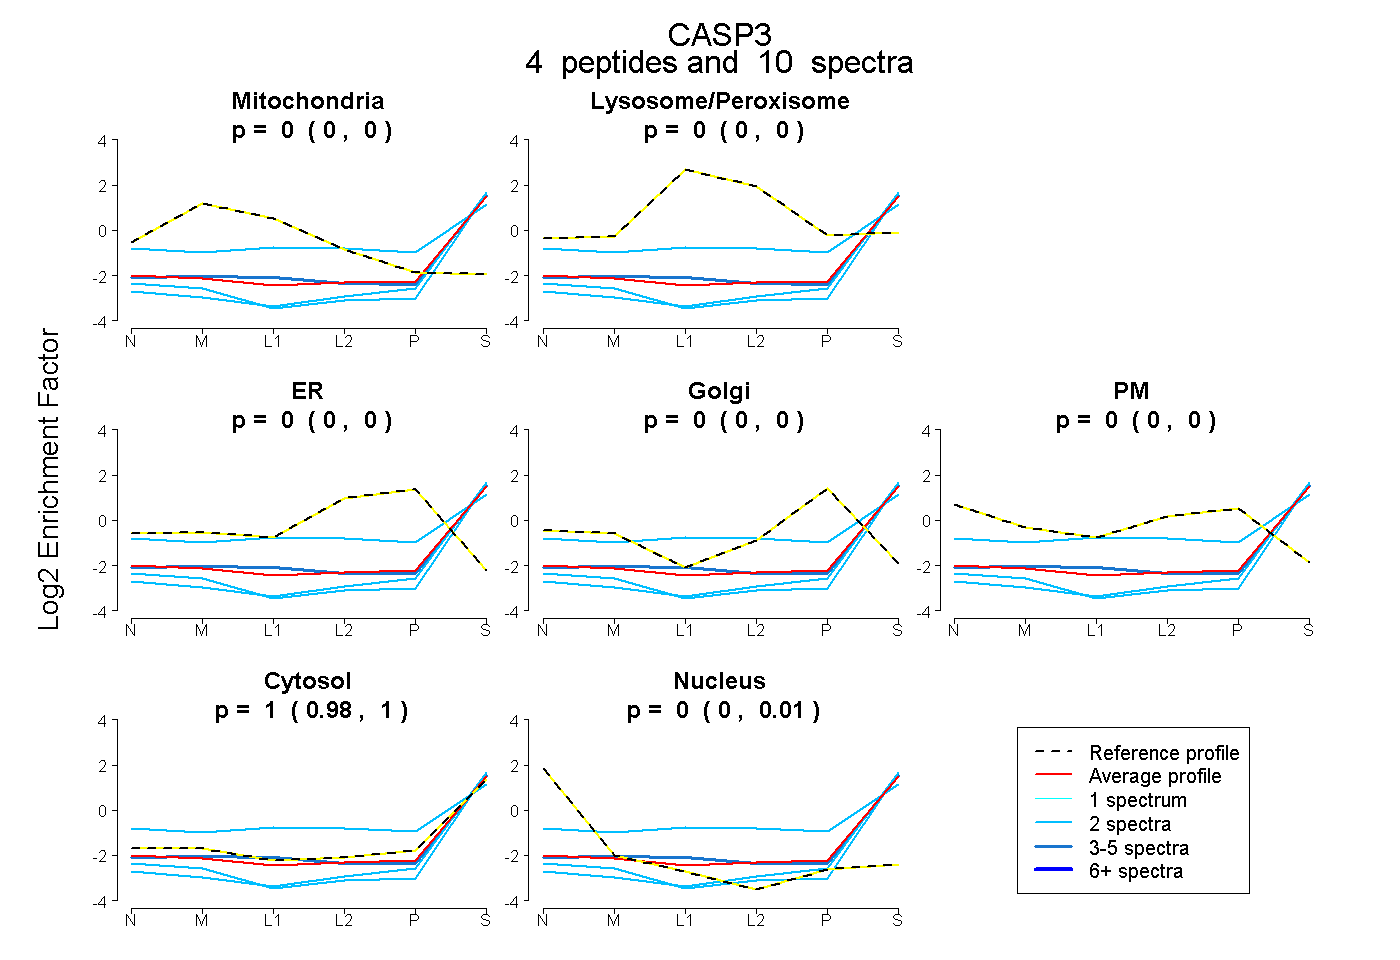 |
0.000 0.000 | 0.000 |
0.000 0.000 | 0.000 |
0.000 0.000 | 0.000 |
0.000 0.000 | 0.000 |
0.000 0.000 | 0.000 |
1.000 0.980 | 1.000 |
0.000 0.000 | 0.014 |
|||
| Plot | Lyso | Other | |||||||||||
| Expt C |
7 peptides |
16 spectra |
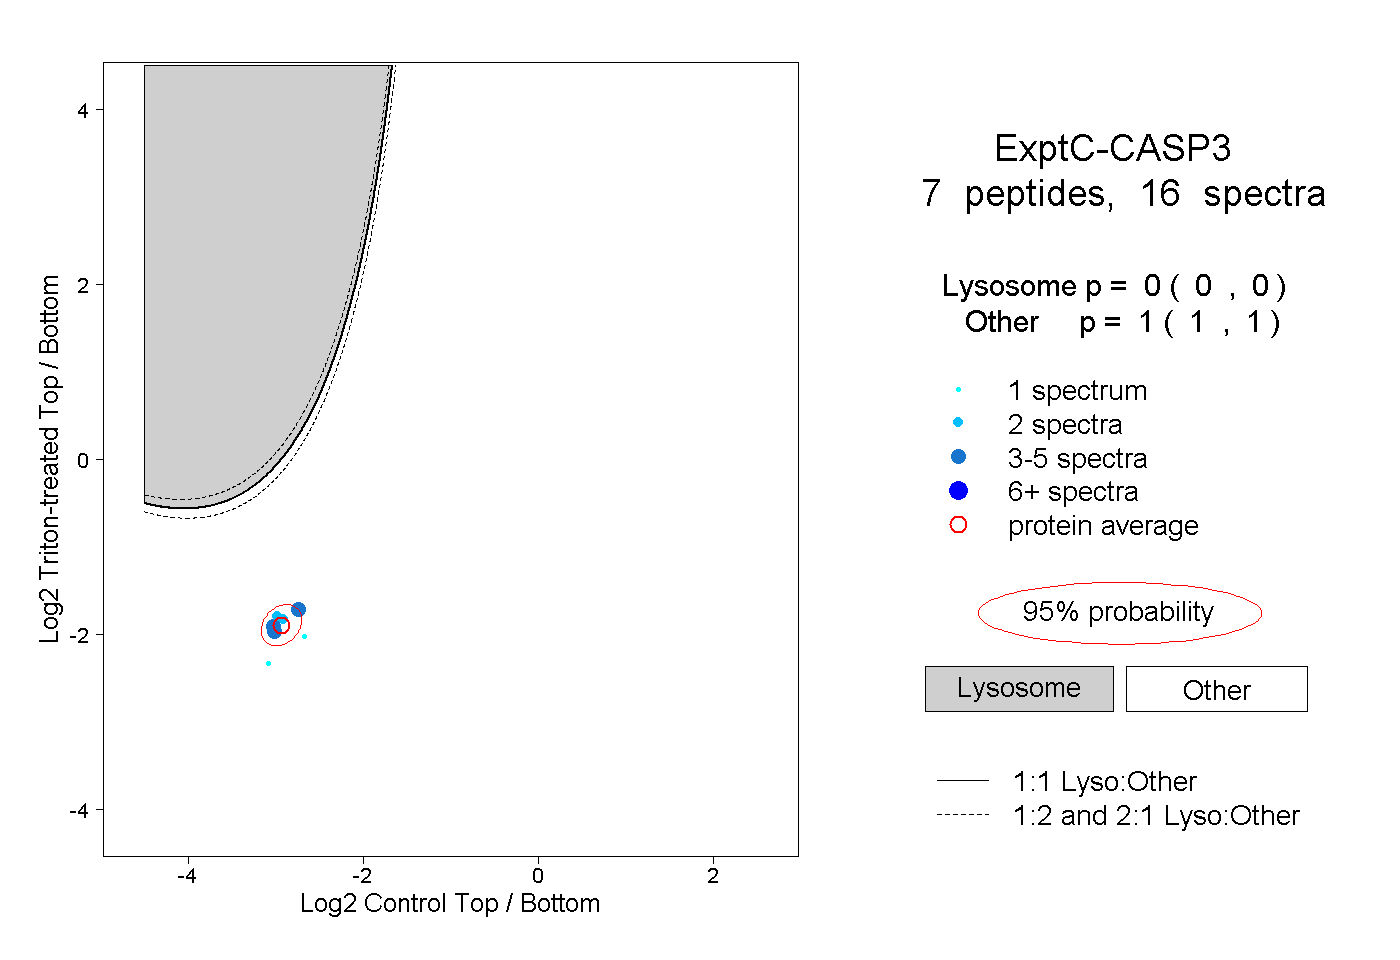 |
0.000 0.000 | 0.000 |
1.000 1.000 | 1.000 |
||||||||
| Plot | Lyso | Other | |||||||||||
| Expt D |
1 peptide |
1 spectrum |
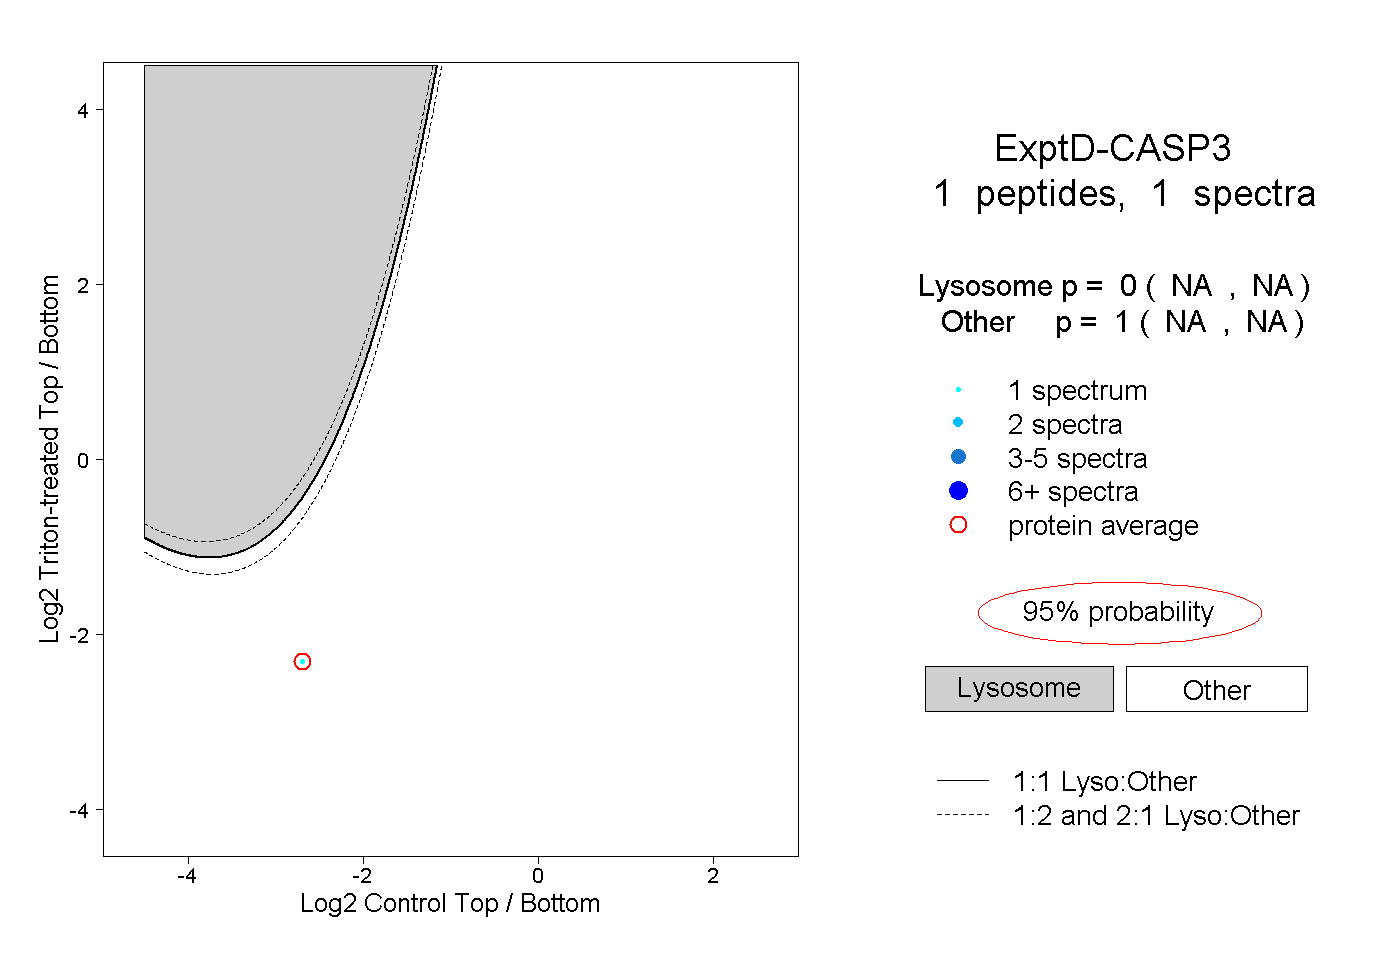 |
0.000 NA | NA |
1.000 NA | NA |