SERPINA3N
[ENSRNOP00000014073]
Main page
| | | Plot |
Mito |
Lyso |
|
Perox |
ER |
Golgi |
PM |
Cytosol |
Nucleus |
|
| Expt A |
 10
10
peptides |
68
spectra |
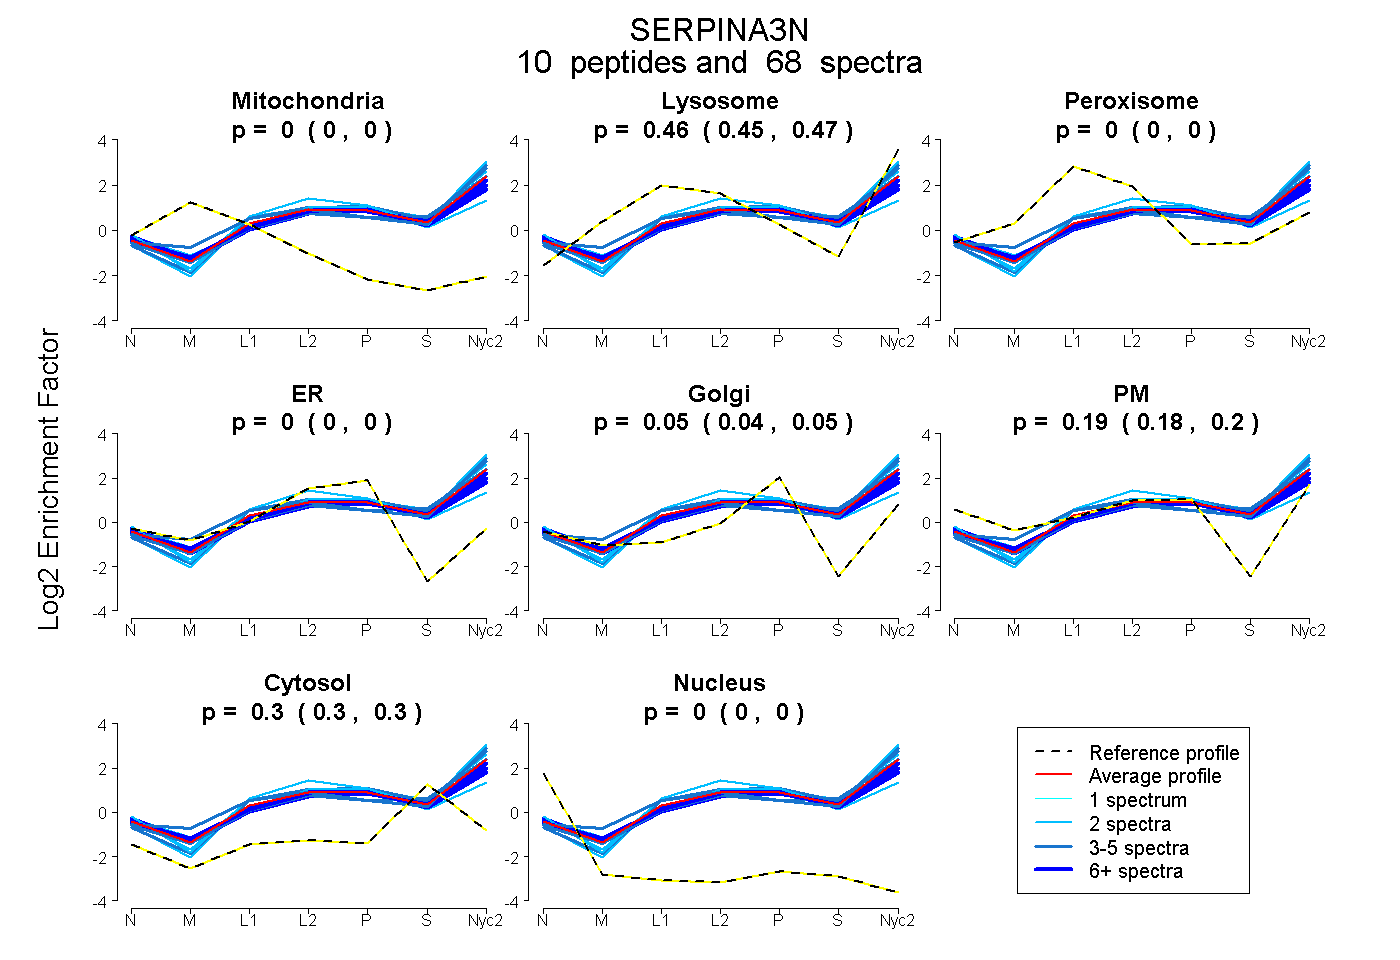 |
0.000
0.000 | 0.000 |
0.460
0.454 | 0.465 |
|
0.000
0.000 | 0.000 |
0.000
0.000 | 0.000 |
0.046
0.039 | 0.052 |
0.193
0.184 | 0.200 |
0.301
0.297 | 0.304 |
0.000
0.000 | 0.000 |
|
| | | Plot |
Mito |
|
Lyso or Perox |
|
ER |
Golgi |
PM |
Cytosol |
Nucleus |
|
| Expt B |
5
peptides |
22
spectra |
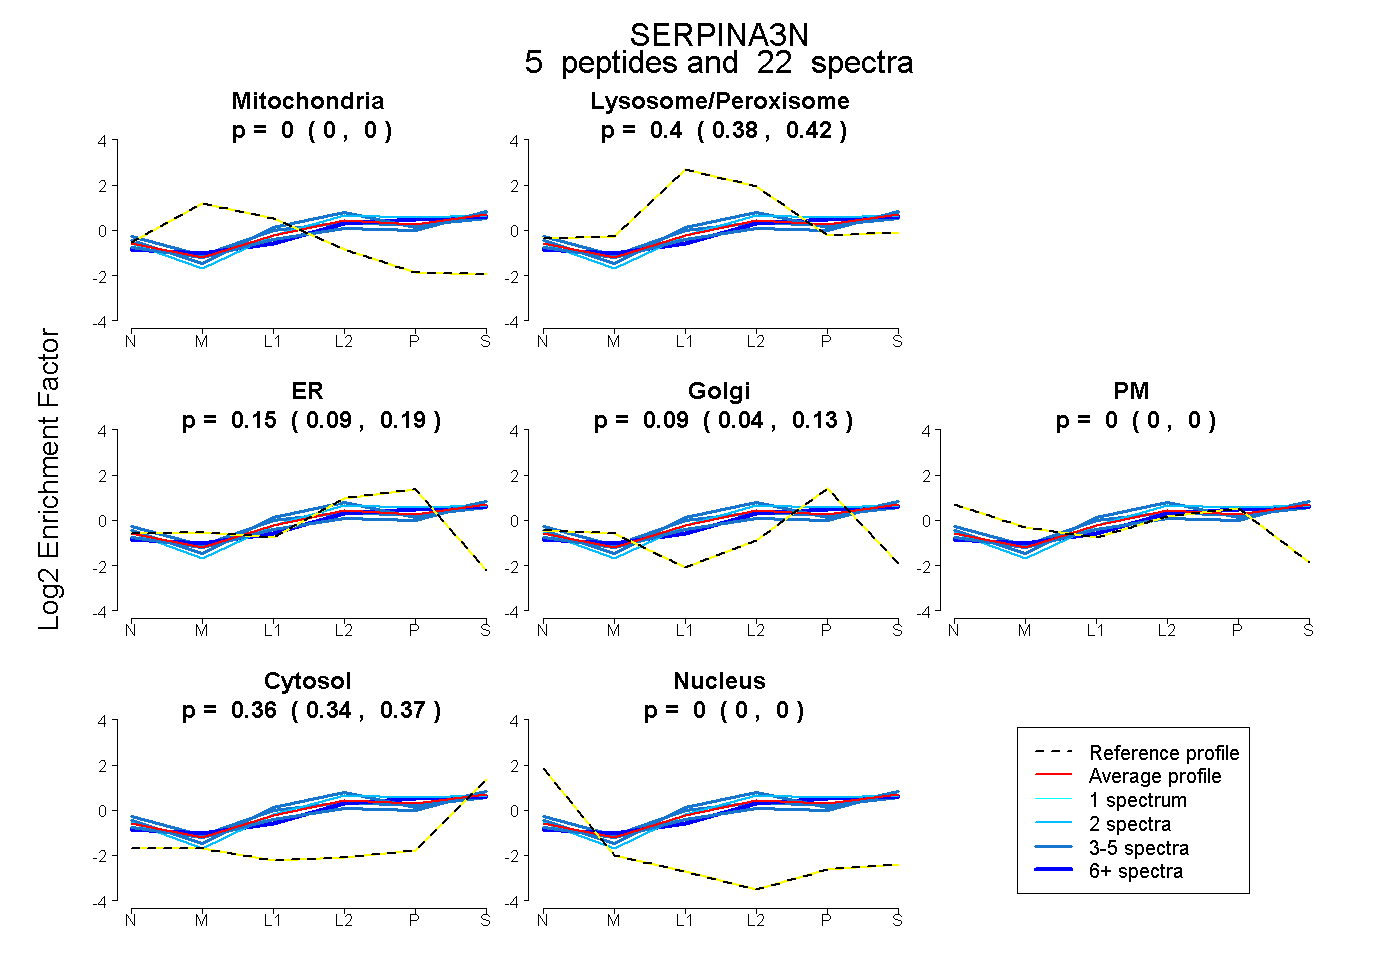 |
0.000
0.000 | 0.000 |
|
0.403
0.382 | 0.420 |
|
0.150
0.094 | 0.194 |
0.089
0.043 | 0.130 |
0.000
0.000 | 0.000 |
0.358
0.343 | 0.370 |
0.000
0.000 | 0.000 |
|
| 3 spectra, LQVLAEFQEK |
0.000 |
|
0.384 |
|
0.072 |
0.108 |
0.000 |
0.435 |
0.000 |
|
| 4 spectra, IQGLITNLAK |
0.000 |
|
0.482 |
|
0.165 |
0.000 |
0.000 |
0.352 |
0.000 |
|
| 2 spectra, LINDYVSK |
0.000 |
|
0.363 |
|
0.288 |
0.000 |
0.000 |
0.349 |
0.000 |
|
| 10 spectra, GFGHLLQR |
0.000 |
|
0.310 |
|
0.227 |
0.096 |
0.000 |
0.366 |
0.000 |
|
| 3 spectra, DTFQSEFYSGK |
0.000 |
|
0.473 |
|
0.000 |
0.207 |
0.023 |
0.297 |
0.000 |
|
| | | Plot |
|
Lyso |
|
|
|
|
|
|
|
Other |
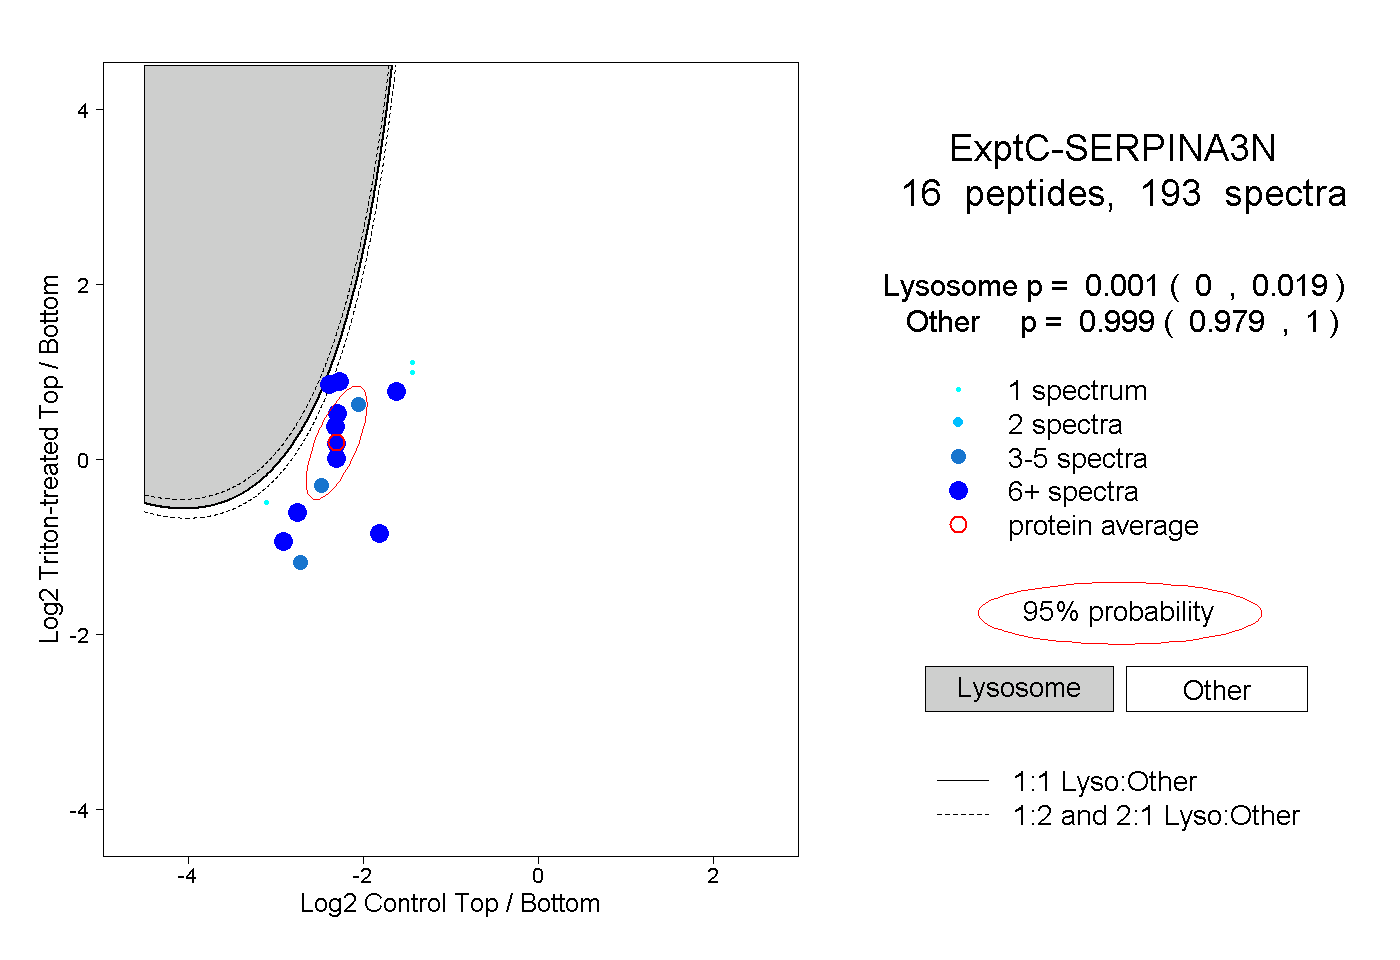
| Expt C |
16
peptides |
193
spectra |
 |
|
0.001
0.000 | 0.019 |
|
|
|
|
|
|
|
0.999
0.979 | 1.000 |
| | | Plot |
|
Lyso |
|
|
|
|
|
|
|
Other |
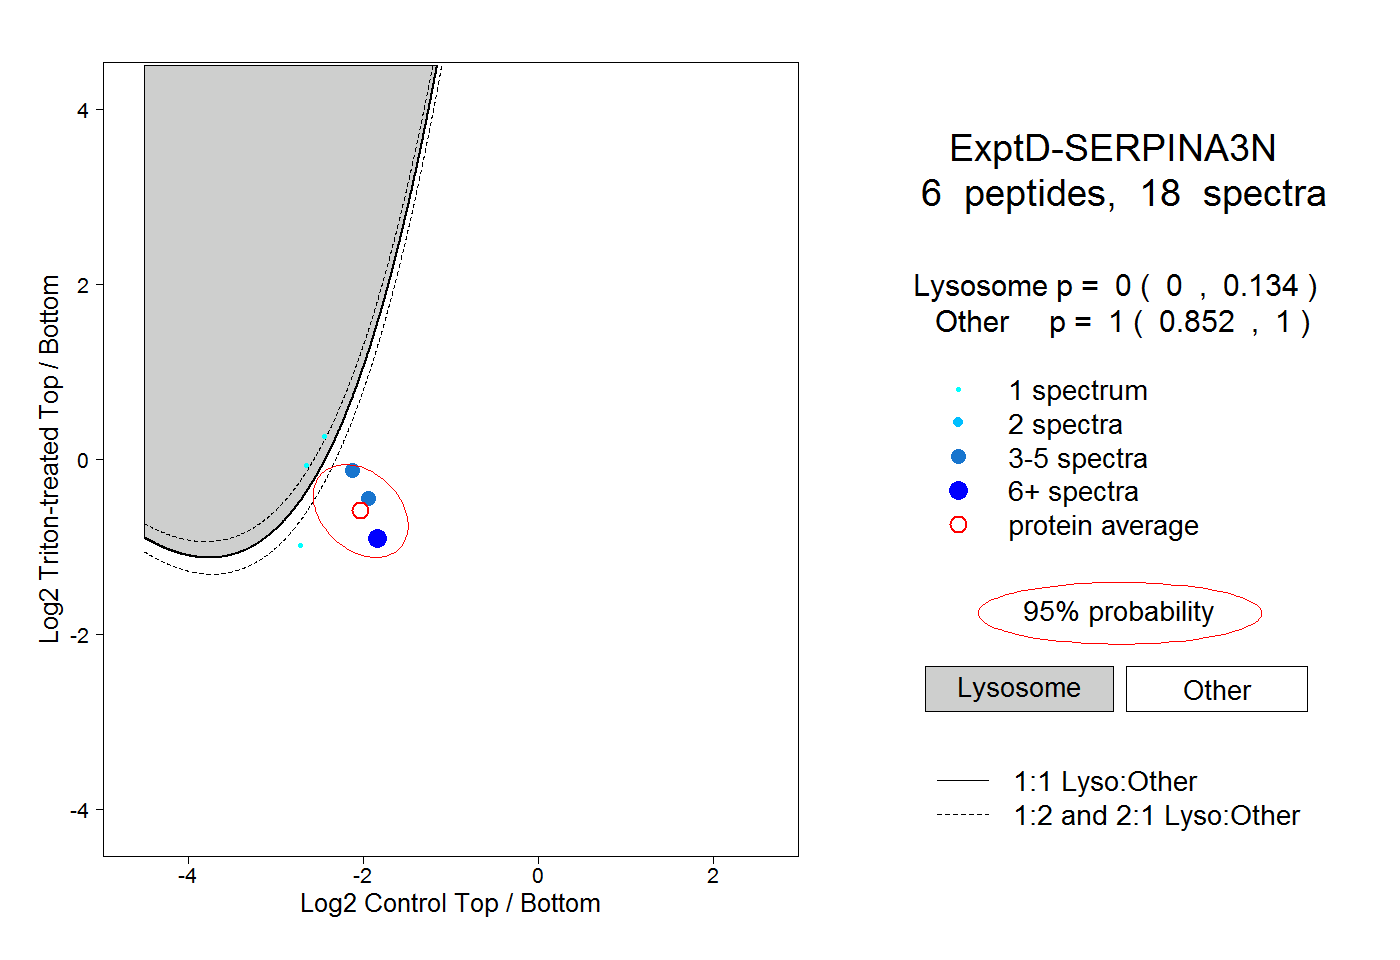
| Expt D |
6
peptides |
18
spectra |
 |
|
0.000
0.000 | 0.134 |
|
|
|
|
|
|
|
1.000
0.852 | 1.000 |