 5
5peptides
spectra
0.000 | 0.000
0.000 | 0.000
0.000 | 0.000
0.000 | 0.000
0.000 | 0.006
0.060 | 0.096
0.897 | 0.918
0.000 | 0.017
| Plot | Mito | Lyso | Perox | ER | Golgi | PM | Cytosol | Nucleus | |||||
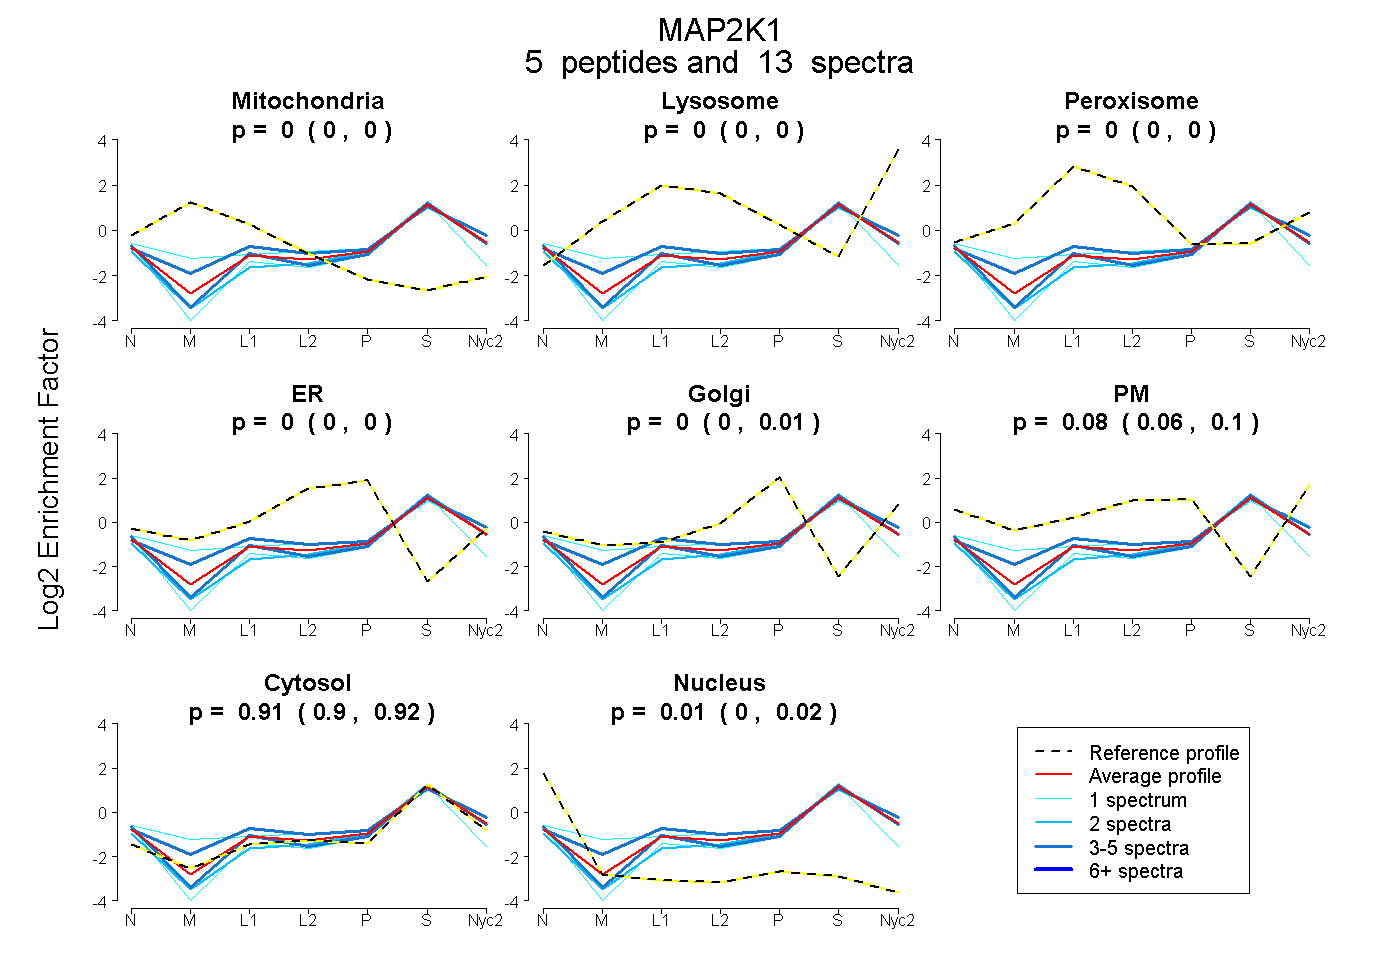
| Expt A |
5 peptides |
13 spectra |
|
0.000 0.000 | 0.000 |
0.000 0.000 | 0.000 |
0.000 0.000 | 0.000 |
0.000 0.000 | 0.000 |
0.000 0.000 | 0.006 |
0.083 0.060 | 0.096 |
0.909 0.897 | 0.918 |
0.009 0.000 | 0.017 |
| 5 spectra, VSHKPSGLVMAR | 0.000 | 0.017 | 0.088 | 0.000 | 0.000 | 0.099 | 0.796 | 0.000 | ||
| 4 spectra, QLMVHAFIK | 0.000 | 0.000 | 0.000 | 0.000 | 0.000 | 0.031 | 0.935 | 0.033 | ||
| 2 spectra, LIHLEIKPAIR | 0.000 | 0.000 | 0.000 | 0.000 | 0.017 | 0.000 | 0.959 | 0.024 | ||
| 1 spectrum, ISELGAGNGGVVFK | 0.042 | 0.015 | 0.036 | 0.000 | 0.000 | 0.163 | 0.744 | 0.000 | ||
| 1 spectrum, ELELLFGCQVEGDAAETPPRPR | 0.000 | 0.000 | 0.000 | 0.000 | 0.000 | 0.000 | 0.882 | 0.118 |
| Plot | Mito | Lyso or Perox | ER | Golgi | PM | Cytosol | Nucleus | ||||||
| Expt B |
1 peptide |
3 spectra |
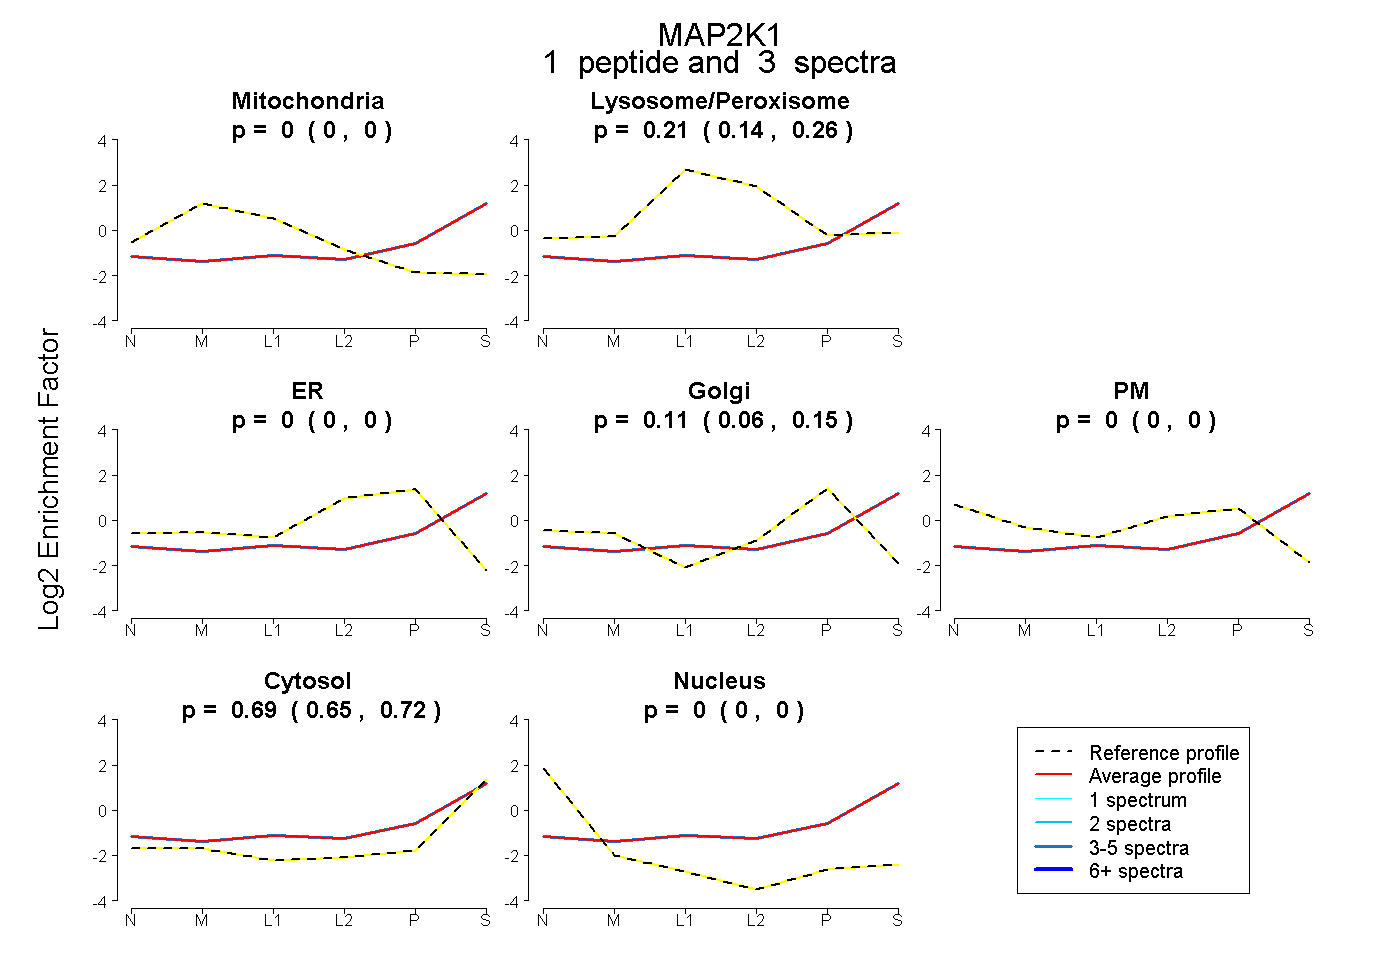 |
0.000 0.000 | 0.000 |
0.206 0.138 | 0.257 |
0.000 0.000 | 0.000 |
0.106 0.060 | 0.148 |
0.000 0.000 | 0.000 |
0.687 0.651 | 0.719 |
0.000 0.000 | 0.000 |
|||
| Plot | Lyso | Other | |||||||||||
| Expt C |
5 peptides |
12 spectra |
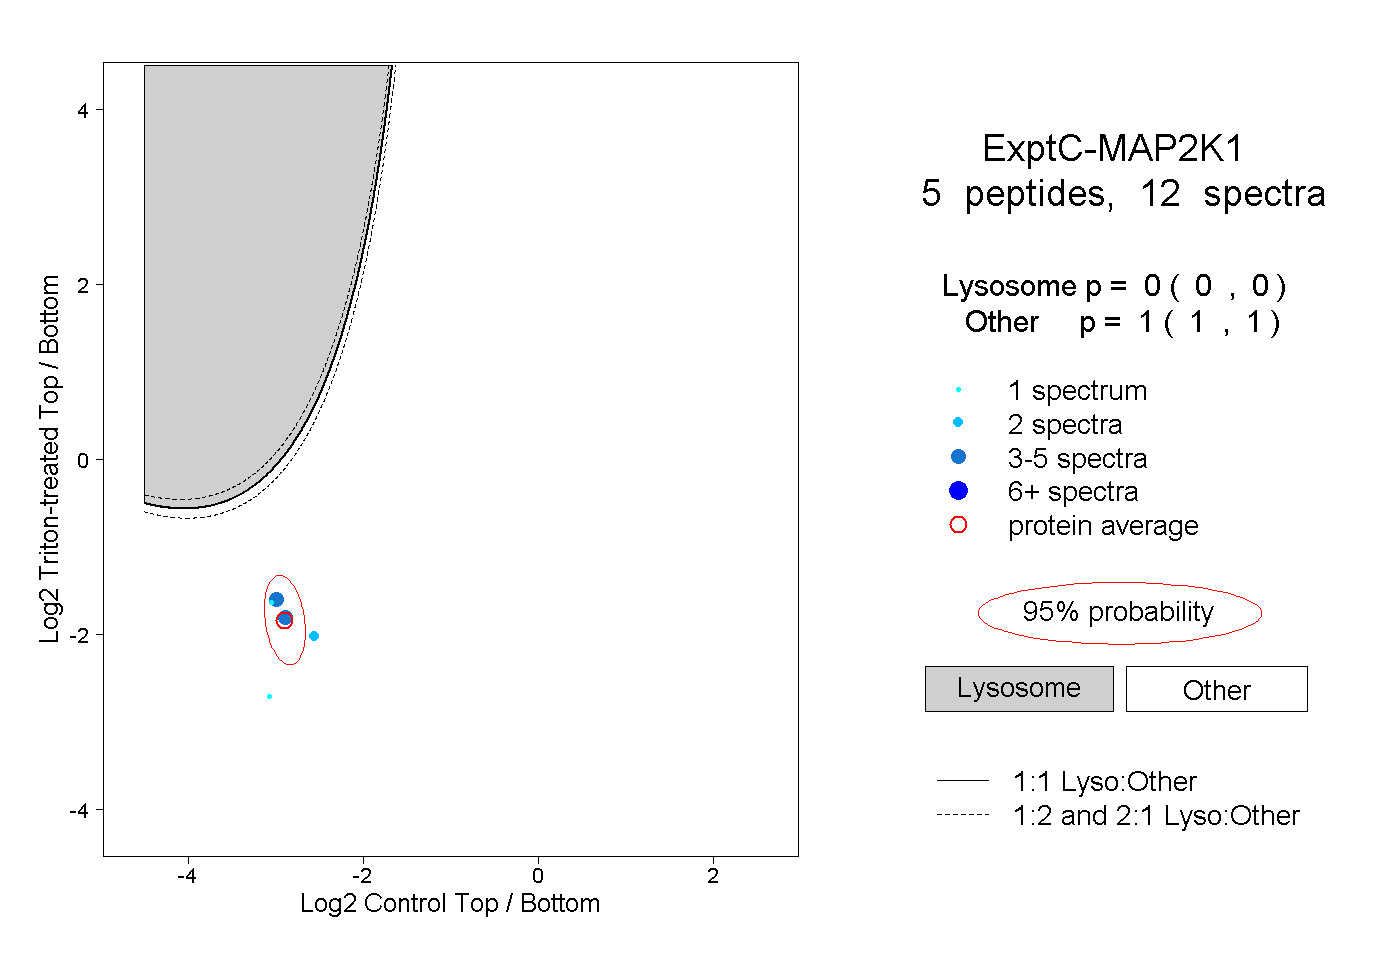 |
0.000 0.000 | 0.000 |
1.000 1.000 | 1.000 |