 2
2peptides
spectra

0.000 | 0.000
0.000 | 0.000
0.000 | 0.000
0.000 | 0.000
0.000 | 0.000
0.000 | 0.000
0.000 | 0.000
1.000 | 1.000
1peptide
spectra
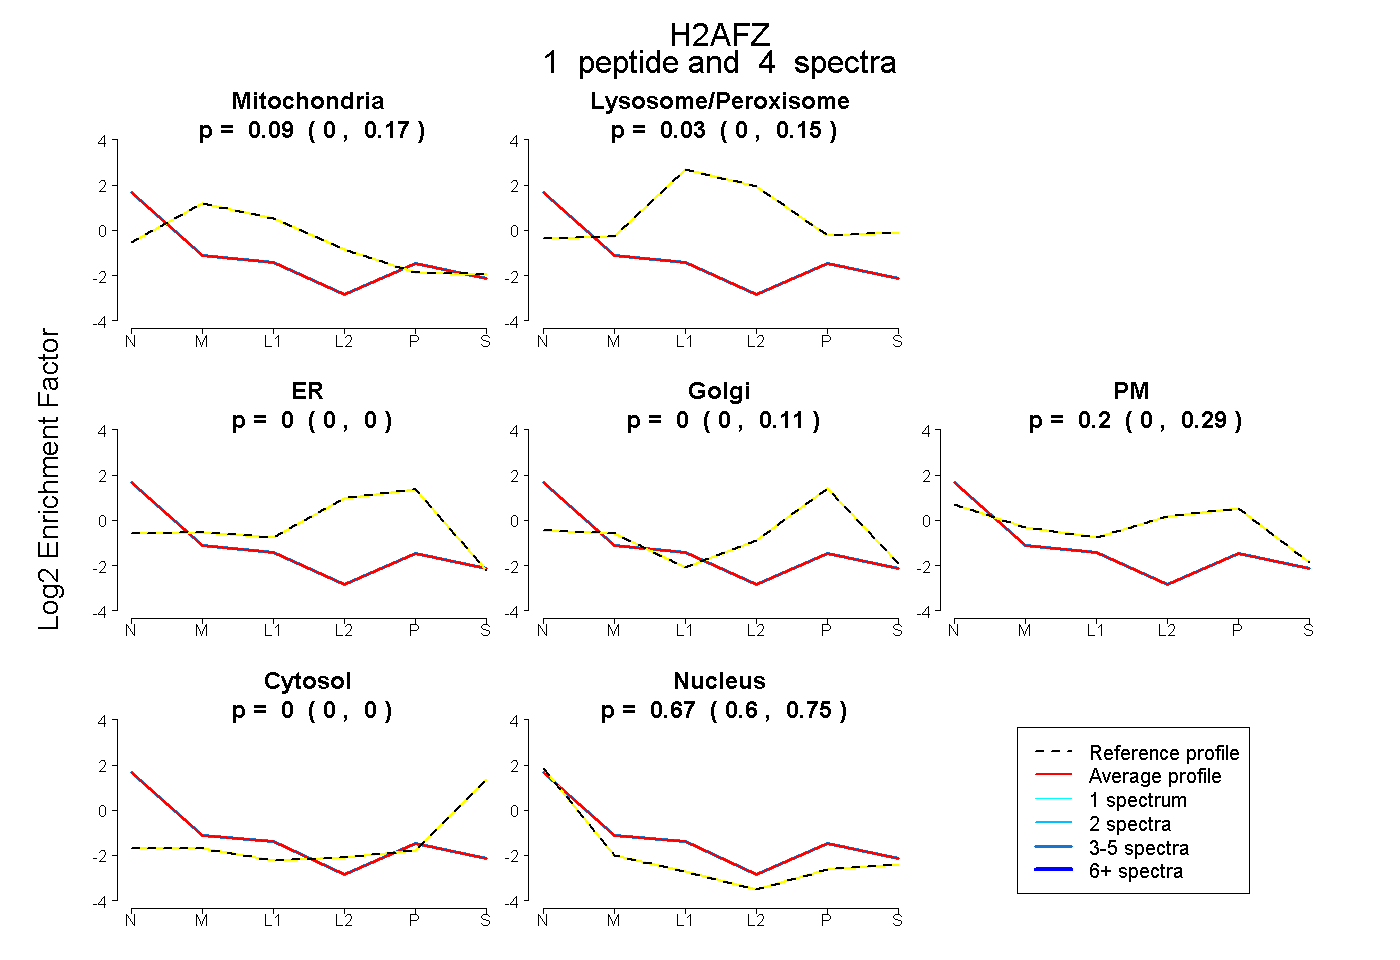
0.000 | 0.175
0.000 | 0.146
0.000 | 0.000
0.000 | 0.109
0.000 | 0.294
0.000 | 0.000
0.600 | 0.751
1peptide
spectrum

NA | NA
NA | NA