15
15peptides
spectra
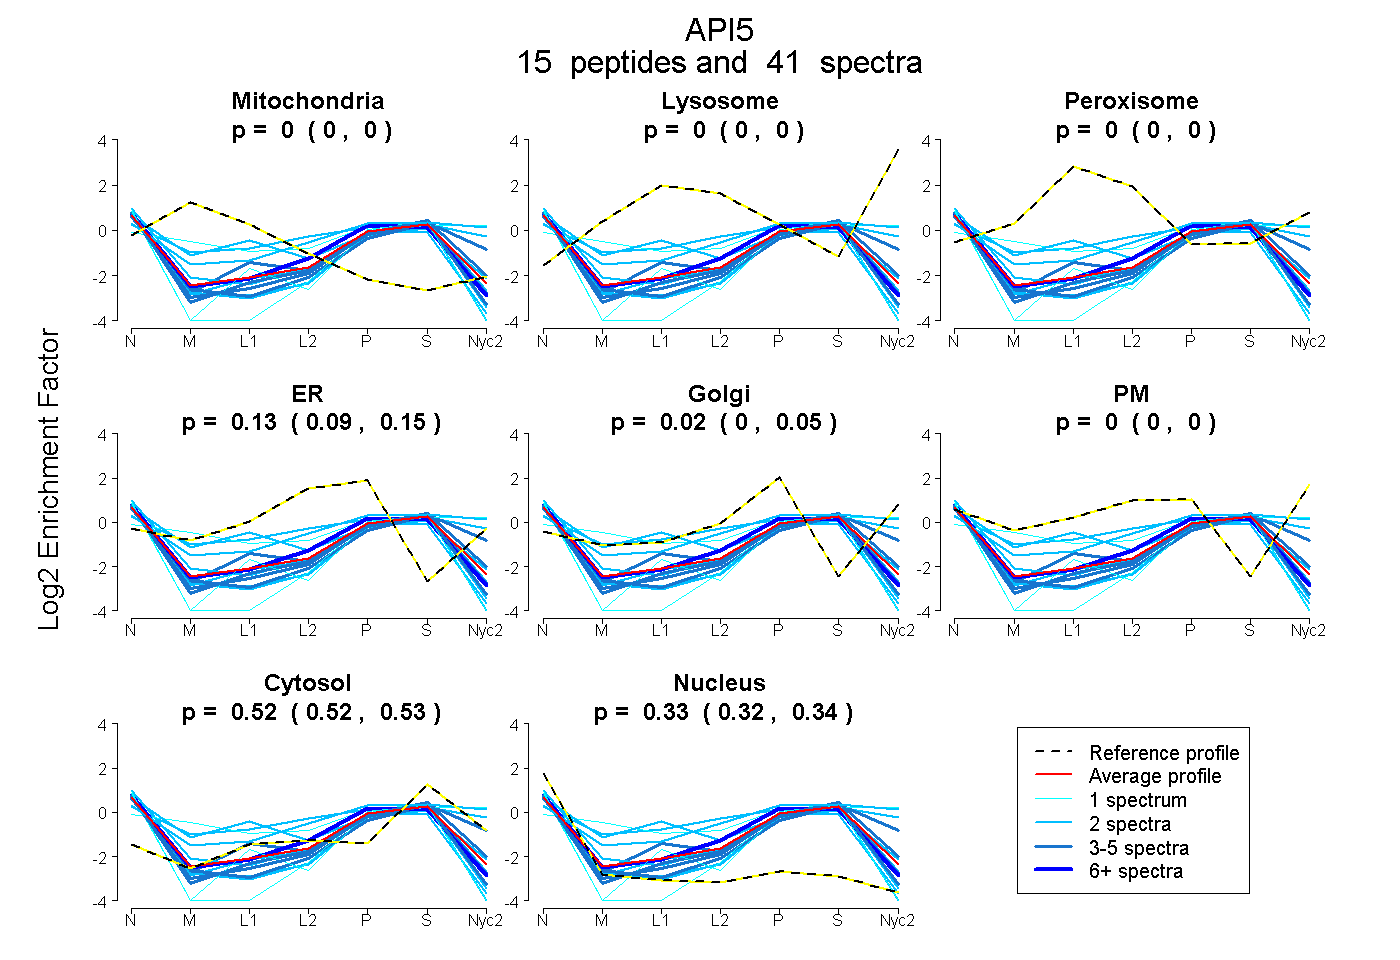
0.000 | 0.000
0.000 | 0.000
0.000 | 0.000
0.095 | 0.148
0.000 | 0.054
0.000 | 0.000
0.518 | 0.526
0.319 | 0.335
8peptides
spectra
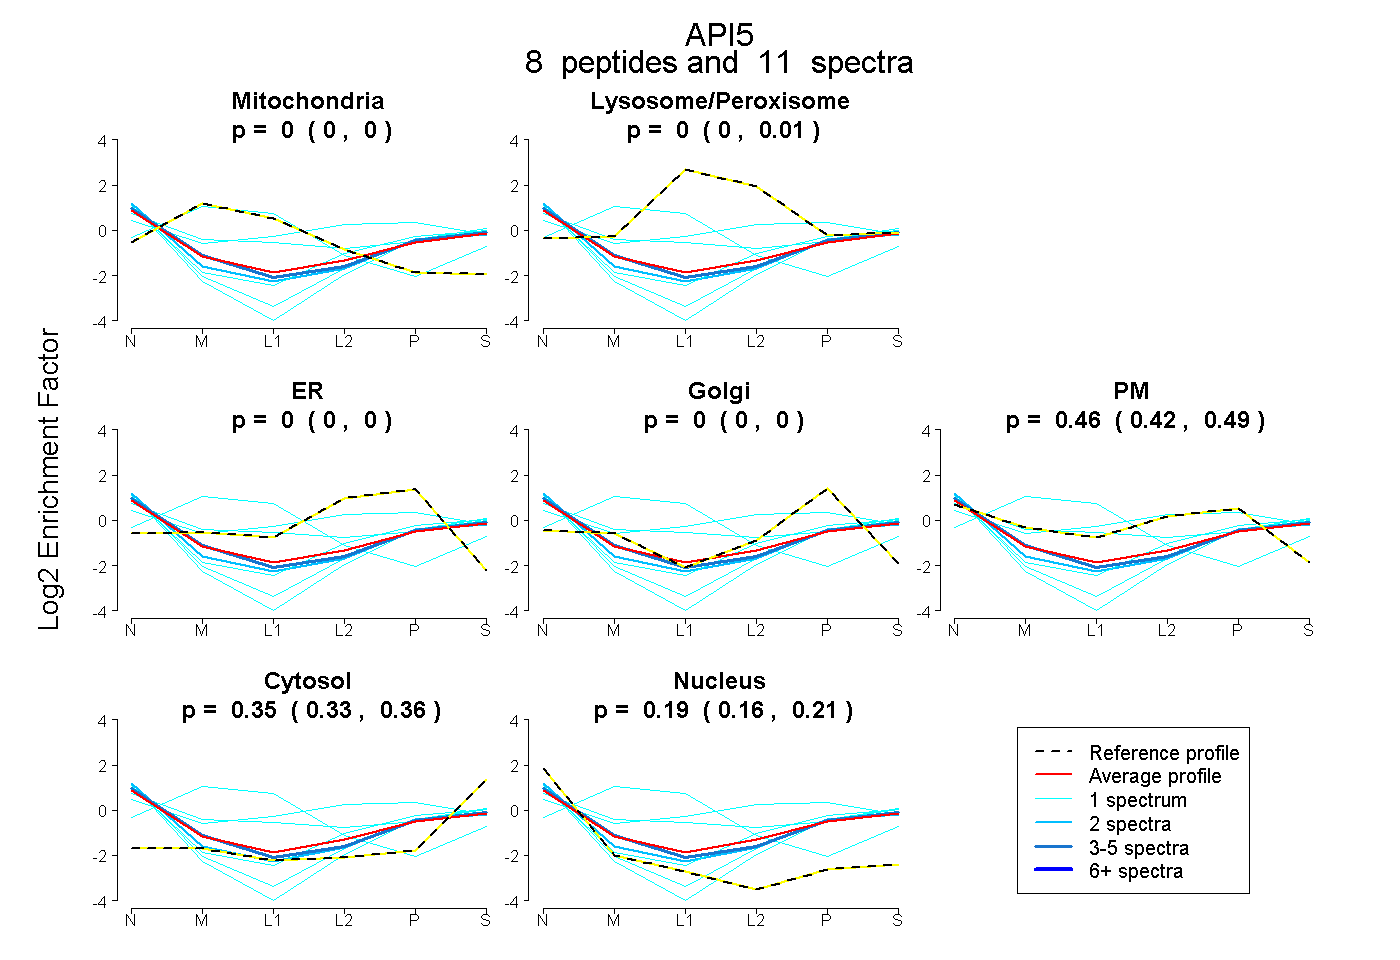
0.000 | 0.000
0.000 | 0.006
0.000 | 0.000
0.000 | 0.000
0.425 | 0.489
0.329 | 0.362
0.163 | 0.211