 15
15peptides
spectra
0.000 | 0.000
0.000 | 0.000
0.000 | 0.000
0.095 | 0.148
0.000 | 0.054
0.000 | 0.000
0.518 | 0.526
0.319 | 0.335
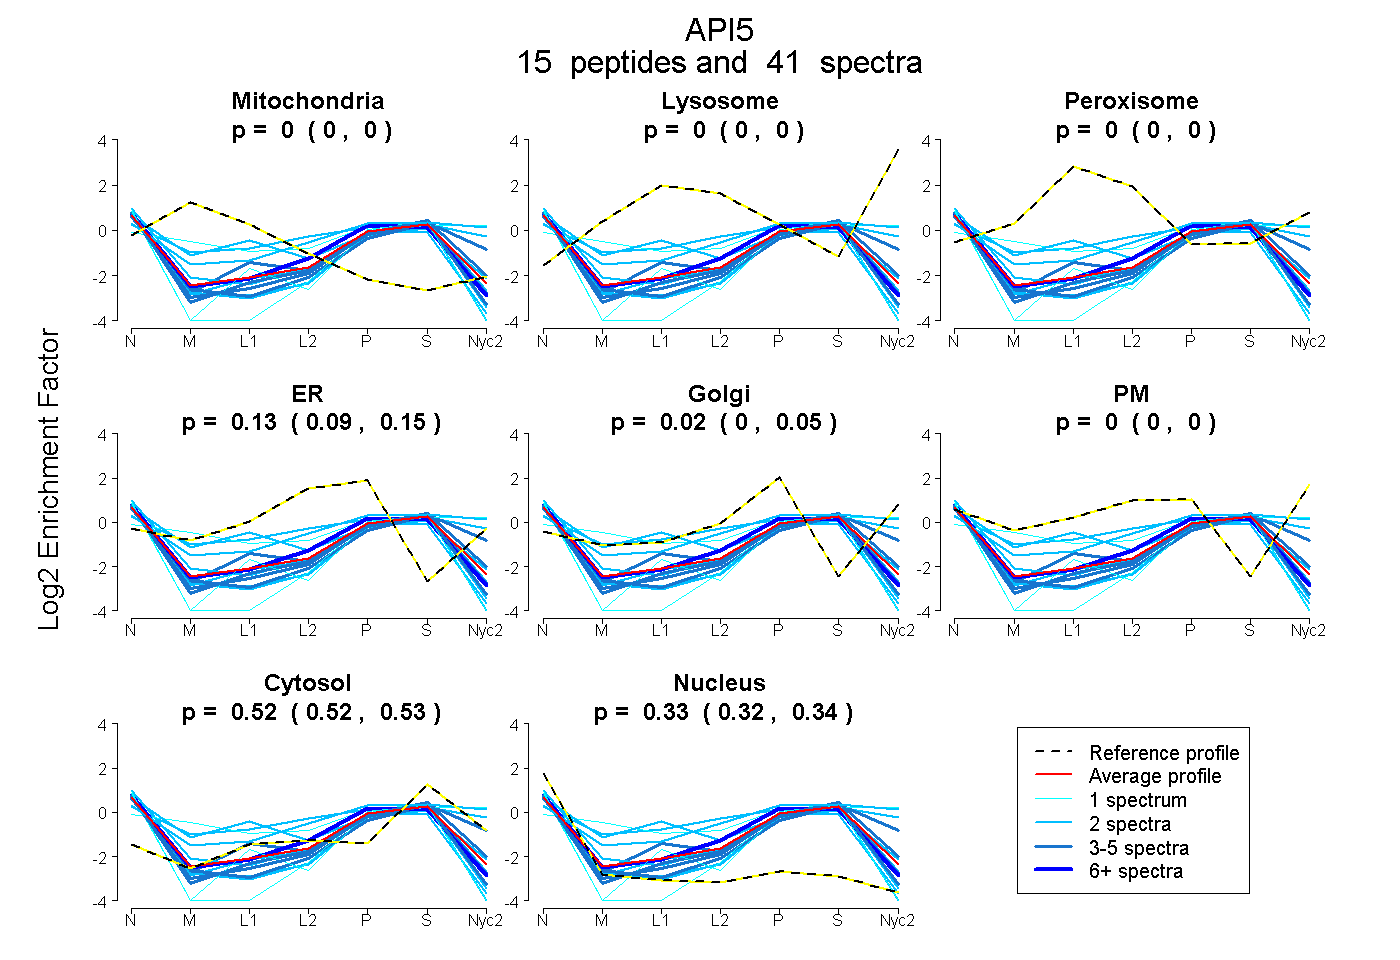
| Plot | Mito | Lyso | Perox | ER | Golgi | PM | Cytosol | Nucleus | |||||
| Expt A |
15 peptides |
41 spectra |
|
0.000 0.000 | 0.000 |
0.000 0.000 | 0.000 |
0.000 0.000 | 0.000 |
0.129 0.095 | 0.148 |
0.021 0.000 | 0.054 |
0.000 0.000 | 0.000 |
0.522 0.518 | 0.526 |
0.328 0.319 | 0.335 |
| 3 spectra, LLAEMSSFCGDMEK | 0.000 | 0.000 | 0.000 | 0.000 | 0.043 | 0.000 | 0.526 | 0.431 | ||
| 1 spectrum, QIYNPPSGK | 0.000 | 0.000 | 0.000 | 0.000 | 0.224 | 0.000 | 0.565 | 0.211 | ||
| 7 spectra, LLQCTR | 0.000 | 0.000 | 0.000 | 0.195 | 0.000 | 0.000 | 0.452 | 0.353 | ||
| 2 spectra, ELPQFATGENLPR | 0.000 | 0.000 | 0.000 | 0.092 | 0.000 | 0.000 | 0.536 | 0.372 | ||
| 2 spectra, DLFHIPPSYK | 0.005 | 0.000 | 0.036 | 0.058 | 0.000 | 0.359 | 0.517 | 0.026 | ||
| 2 spectra, TSEDTSSGSPPK | 0.000 | 0.000 | 0.000 | 0.000 | 0.127 | 0.304 | 0.557 | 0.012 | ||
| 5 spectra, SLQTVSGR | 0.000 | 0.000 | 0.000 | 0.000 | 0.106 | 0.000 | 0.563 | 0.330 | ||
| 4 spectra, GLQVYIR | 0.000 | 0.000 | 0.000 | 0.000 | 0.236 | 0.001 | 0.574 | 0.188 | ||
| 2 spectra, LETNLR | 0.000 | 0.000 | 0.000 | 0.000 | 0.000 | 0.000 | 0.507 | 0.493 | ||
| 1 spectrum, QAVPLFSK | 0.000 | 0.000 | 0.000 | 0.000 | 0.000 | 0.000 | 0.429 | 0.571 | ||
| 2 spectra, ILSGLK | 0.000 | 0.000 | 0.000 | 0.152 | 0.000 | 0.000 | 0.367 | 0.481 | ||
| 1 spectrum, ITNNINVLIK | 0.266 | 0.000 | 0.000 | 0.171 | 0.000 | 0.000 | 0.413 | 0.150 | ||
| 2 spectra, LAAQFIPK | 0.060 | 0.000 | 0.166 | 0.149 | 0.000 | 0.000 | 0.373 | 0.252 | ||
| 5 spectra, LQYFAR | 0.000 | 0.000 | 0.000 | 0.059 | 0.000 | 0.000 | 0.513 | 0.428 | ||
| 2 spectra, EVEELILTESK | 0.000 | 0.000 | 0.000 | 0.000 | 0.000 | 0.000 | 0.477 | 0.523 |
| Plot | Mito | Lyso or Perox | ER | Golgi | PM | Cytosol | Nucleus | ||||||
| Expt B |
8 peptides |
11 spectra |
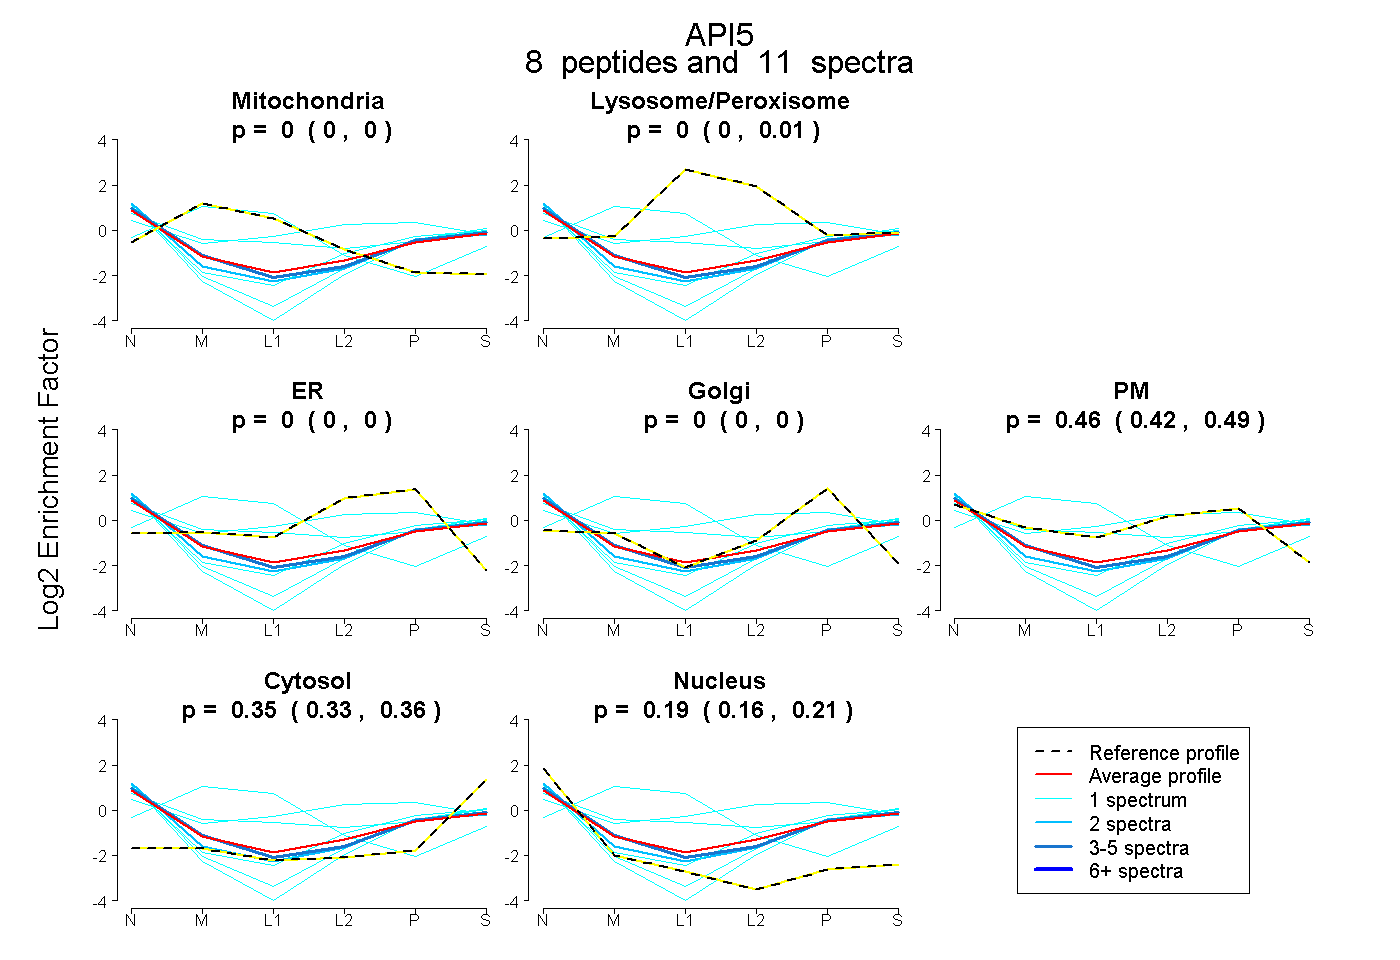 |
0.000 0.000 | 0.000 |
0.000 0.000 | 0.006 |
0.000 0.000 | 0.000 |
0.000 0.000 | 0.000 |
0.464 0.425 | 0.489 |
0.348 0.329 | 0.362 |
0.188 0.163 | 0.211 |
|||
| Plot | Lyso | Other | |||||||||||
| Expt C |
10 peptides |
15 spectra |
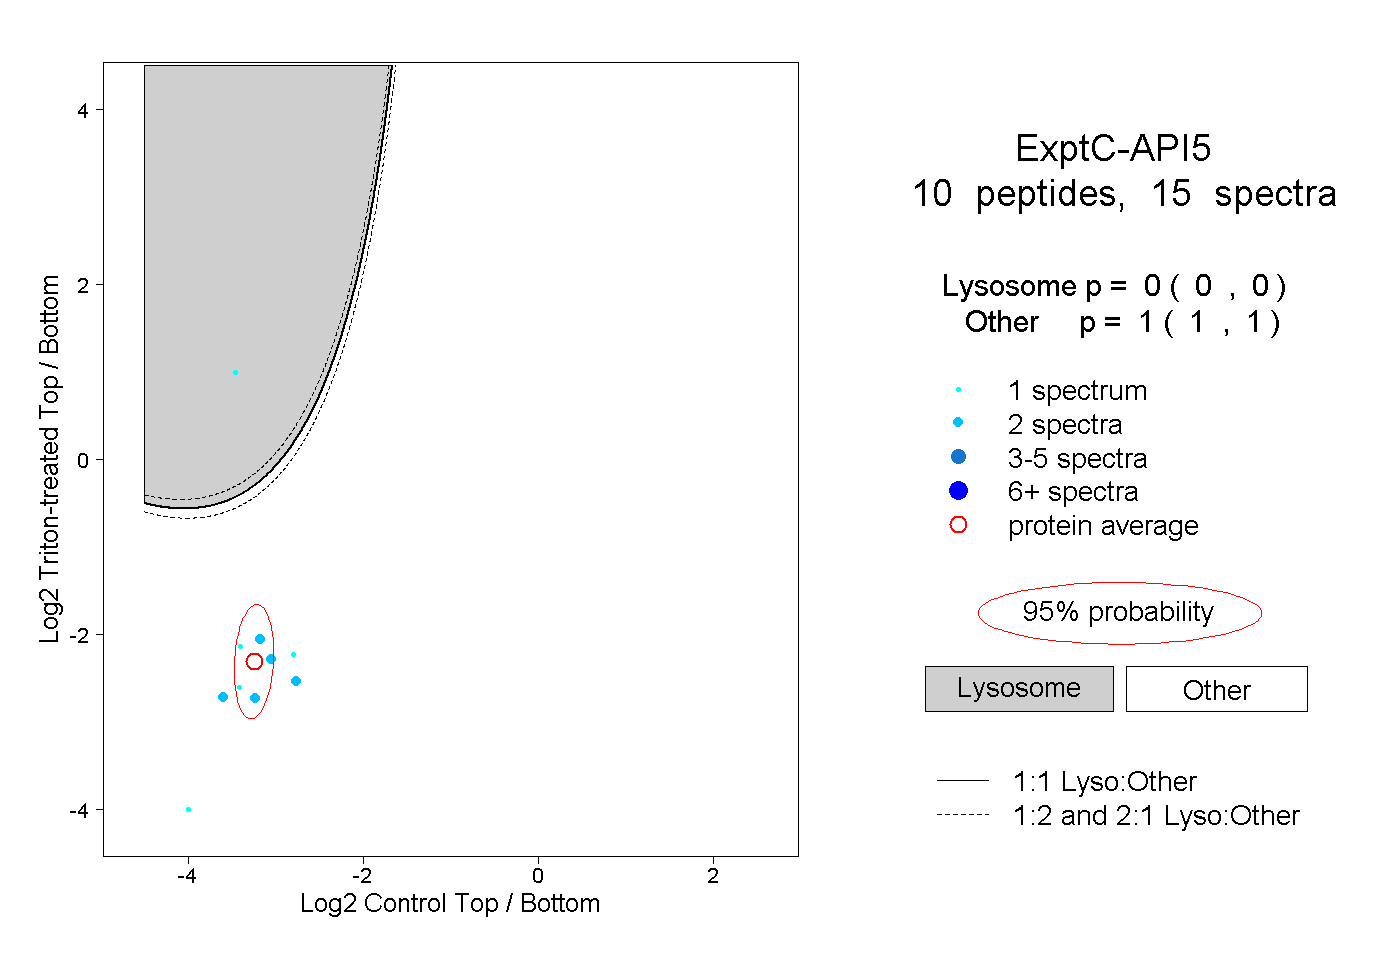 |
0.000 0.000 | 0.000 |
1.000 1.000 | 1.000 |
||||||||
| Plot | Lyso | Other | |||||||||||
| Expt D |
3 peptides |
7 spectra |
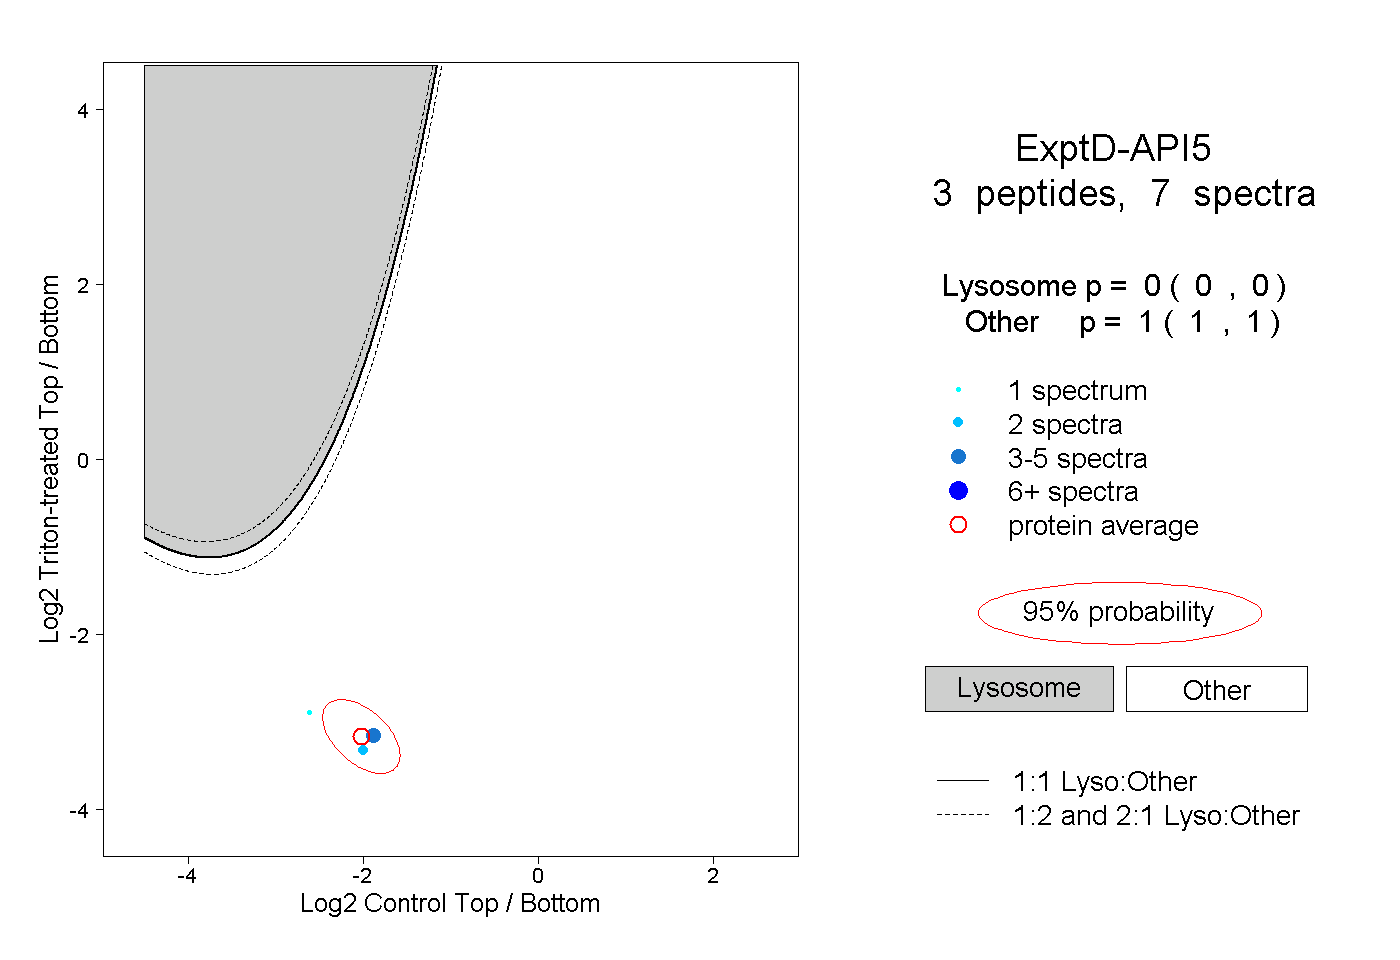 |
0.000 0.000 | 0.000 |
1.000 1.000 | 1.000 |