 11
11peptides
spectra

0.000 | 0.000
0.000 | 0.000
0.139 | 0.161
0.358 | 0.406
0.138 | 0.188
0.002 | 0.046
0.264 | 0.281
0.000 | 0.000
9peptides
spectra
0.000 | 0.000
1.000 | 1.000
| Plot | Mito | Lyso | Perox | ER | Golgi | PM | Cytosol | Nucleus | |||||
| Expt A |
11 peptides |
32 spectra |
|
0.000 0.000 | 0.000 |
0.000 0.000 | 0.000 |
0.151 0.139 | 0.161 |
0.384 0.358 | 0.406 |
0.165 0.138 | 0.188 |
0.026 0.002 | 0.046 |
0.274 0.264 | 0.281 |
0.000 0.000 | 0.000 |
||
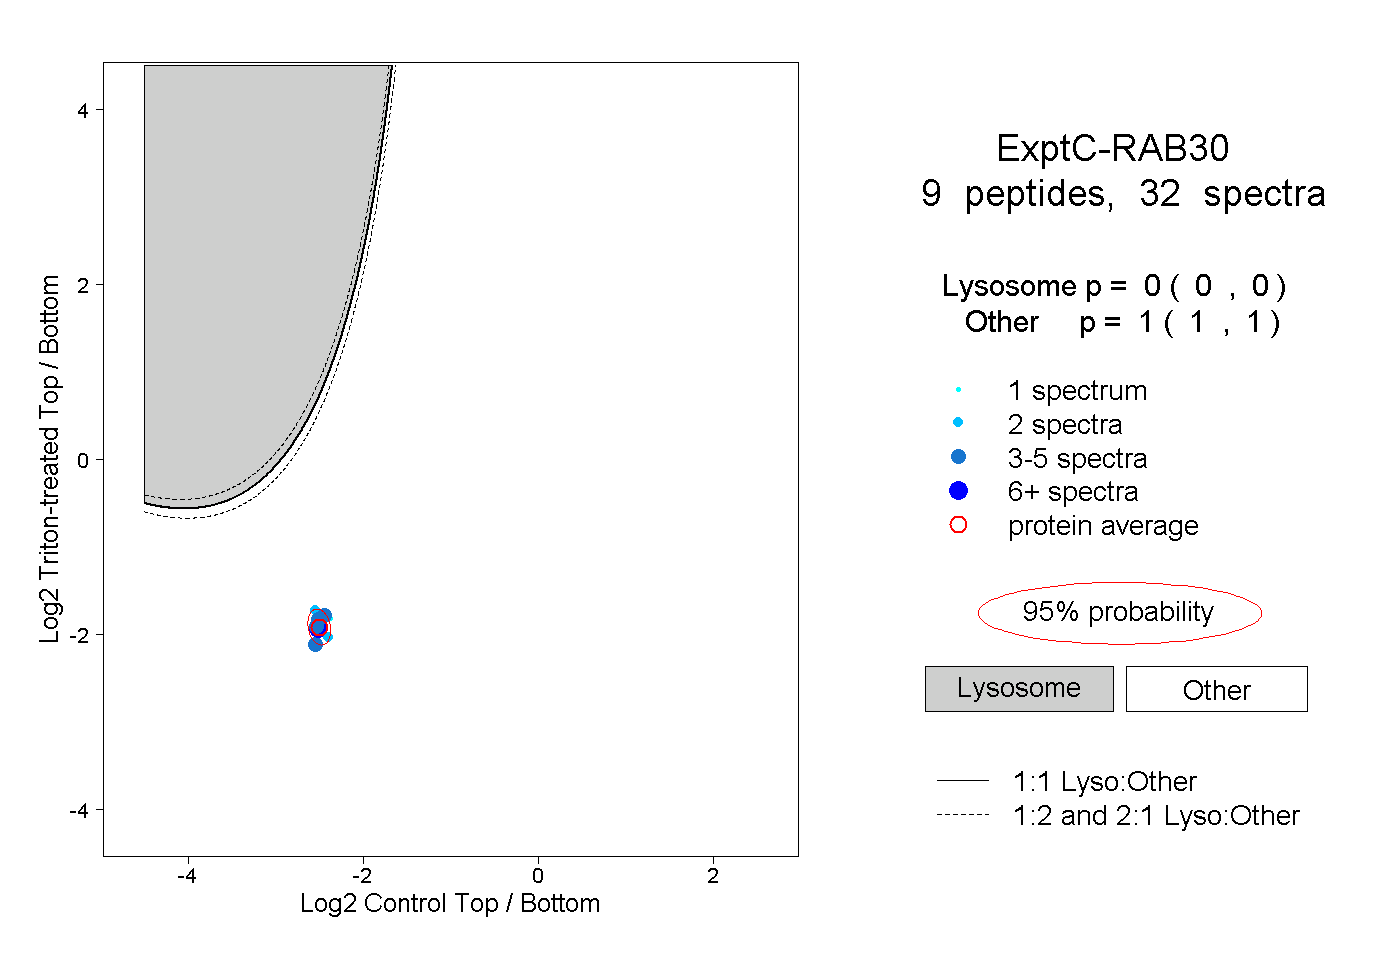
| Plot | Lyso | Other | |||||||||||
| Expt C |
9 peptides |
32 spectra |
|
0.000 0.000 | 0.000 |
1.000 1.000 | 1.000 |
| 9 spectra, ESDNVEK | 0.000 | 1.000 | ||||||||
| 1 spectrum, IDLAER | 0.000 | 1.000 | ||||||||
| 4 spectra, LFLDLACR | 0.000 | 1.000 | ||||||||
| 2 spectra, CLPEWLR | 0.000 | 1.000 | ||||||||
| 5 spectra, SITQSYYR | 0.000 | 1.000 | ||||||||
| 2 spectra, IVLIGNAGVGK | 0.000 | 1.000 | ||||||||
| 3 spectra, EIEQYASNK | 0.000 | 1.000 | ||||||||
| 4 spectra, VITVLVGNK | 0.000 | 1.000 | ||||||||
| 2 spectra, LISEAR | 0.000 | 1.000 |