 10
10peptides
spectra

0.000 | 0.000
0.216 | 0.239
0.577 | 0.602
0.052 | 0.078
0.000 | 0.000
0.094 | 0.130
0.000 | 0.000
0.000 | 0.000
| Plot | Mito | Lyso | Perox | ER | Golgi | PM | Cytosol | Nucleus | |||||
| Expt A |
10 peptides |
55 spectra |
|
0.000 0.000 | 0.000 |
0.229 0.216 | 0.239 |
0.591 0.577 | 0.602 |
0.066 0.052 | 0.078 |
0.000 0.000 | 0.000 |
0.114 0.094 | 0.130 |
0.000 0.000 | 0.000 |
0.000 0.000 | 0.000 |
| 10 spectra, QILSFFGK | 0.000 | 0.409 | 0.448 | 0.072 | 0.000 | 0.071 | 0.000 | 0.000 | ||
| 7 spectra, HLDSTHNR | 0.000 | 0.153 | 0.685 | 0.000 | 0.128 | 0.033 | 0.000 | 0.000 | ||
| 8 spectra, QTMIPPLGHDLR | 0.072 | 0.018 | 0.563 | 0.000 | 0.268 | 0.047 | 0.031 | 0.000 | ||
| 4 spectra, AVVWGGEVR | 0.000 | 0.432 | 0.568 | 0.000 | 0.000 | 0.000 | 0.000 | 0.000 | ||
| 2 spectra, AQIDAWK | 0.000 | 0.311 | 0.554 | 0.100 | 0.000 | 0.035 | 0.000 | 0.000 | ||
| 8 spectra, VAFSGILDIVDIR | 0.000 | 0.188 | 0.627 | 0.000 | 0.000 | 0.185 | 0.000 | 0.000 | ||
| 4 spectra, GPILFVAGQDDHCWR | 0.000 | 0.166 | 0.618 | 0.093 | 0.000 | 0.123 | 0.000 | 0.000 | ||
| 1 spectrum, NDAVGGCENPSMIPIEK | 0.000 | 0.432 | 0.525 | 0.044 | 0.000 | 0.000 | 0.000 | 0.000 | ||
| 6 spectra, SELYTQIASER | 0.000 | 0.387 | 0.612 | 0.000 | 0.000 | 0.000 | 0.000 | 0.000 | ||
| 5 spectra, YHADSHGMLDLAR | 0.098 | 0.000 | 0.579 | 0.000 | 0.149 | 0.175 | 0.000 | 0.000 |
| Plot | Mito | Lyso or Perox | ER | Golgi | PM | Cytosol | Nucleus | ||||||
| Expt B |
7 peptides |
14 spectra |
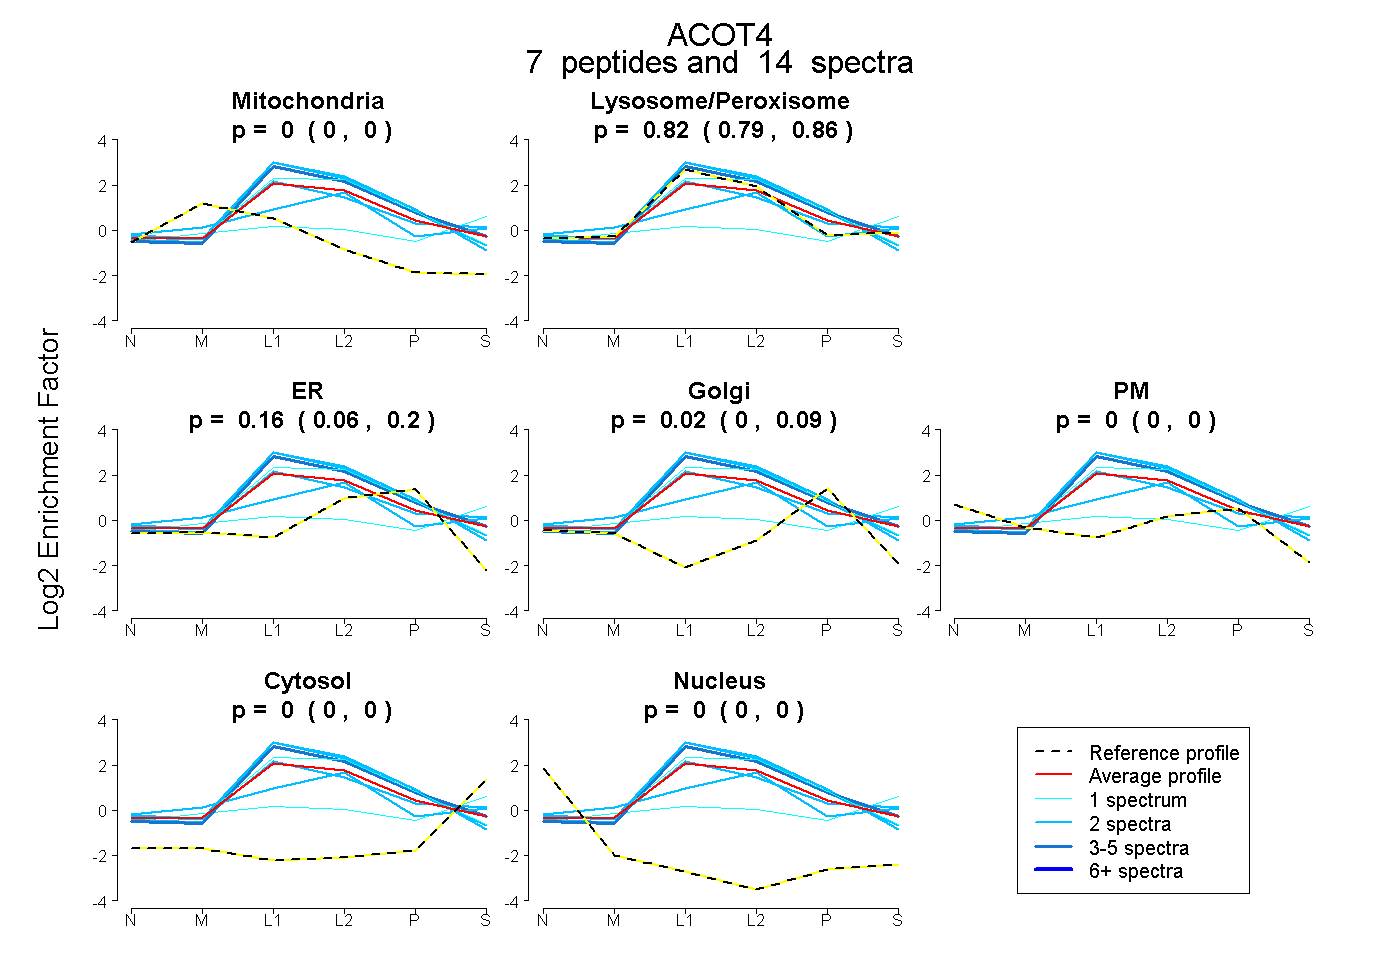 |
0.000 0.000 | 0.000 |
0.821 0.786 | 0.856 |
0.157 0.062 | 0.200 |
0.022 0.000 | 0.086 |
0.000 0.000 | 0.000 |
0.000 0.000 | 0.000 |
0.000 0.000 | 0.000 |
|||
| Plot | Lyso | Other | |||||||||||
| Expt C |
10 peptides |
90 spectra |
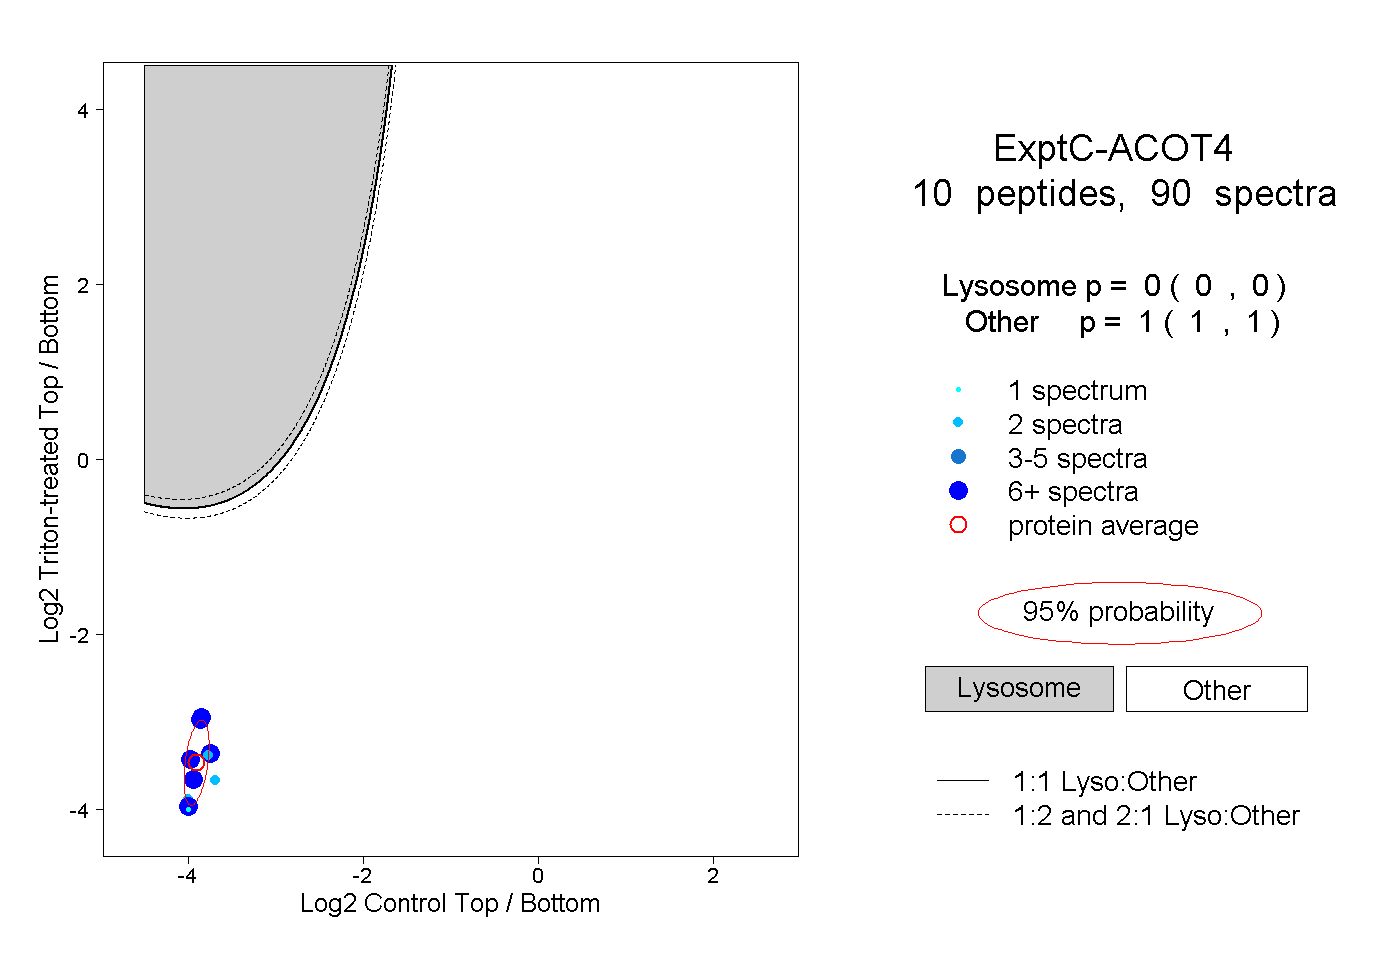 |
0.000 0.000 | 0.000 |
1.000 1.000 | 1.000 |
||||||||
| Plot | Lyso | Other | |||||||||||
| Expt D |
6 peptides |
18 spectra |
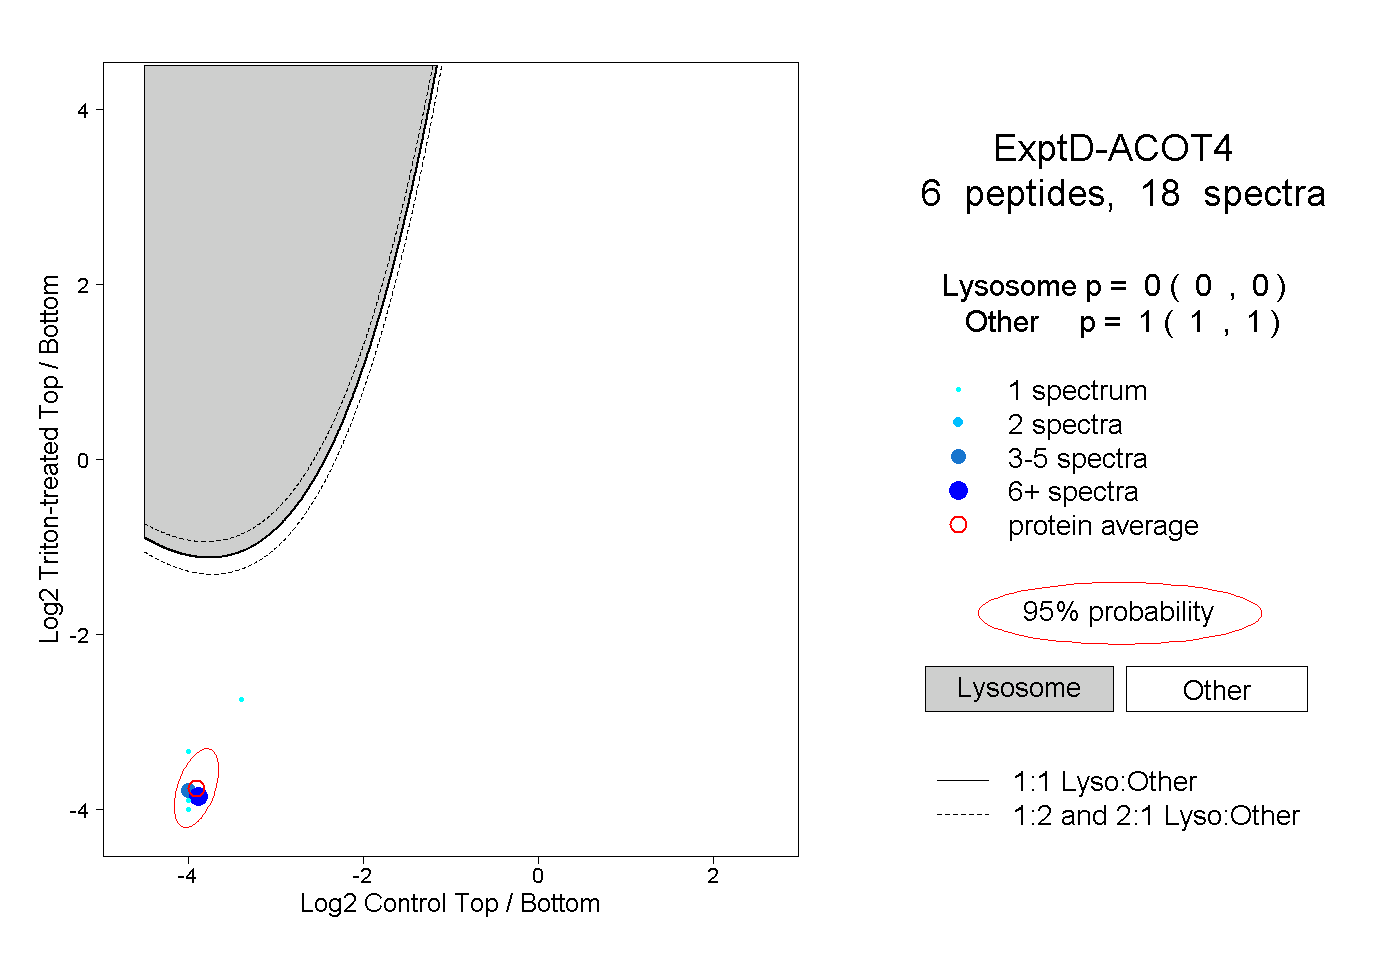 |
0.000 0.000 | 0.000 |
1.000 1.000 | 1.000 |