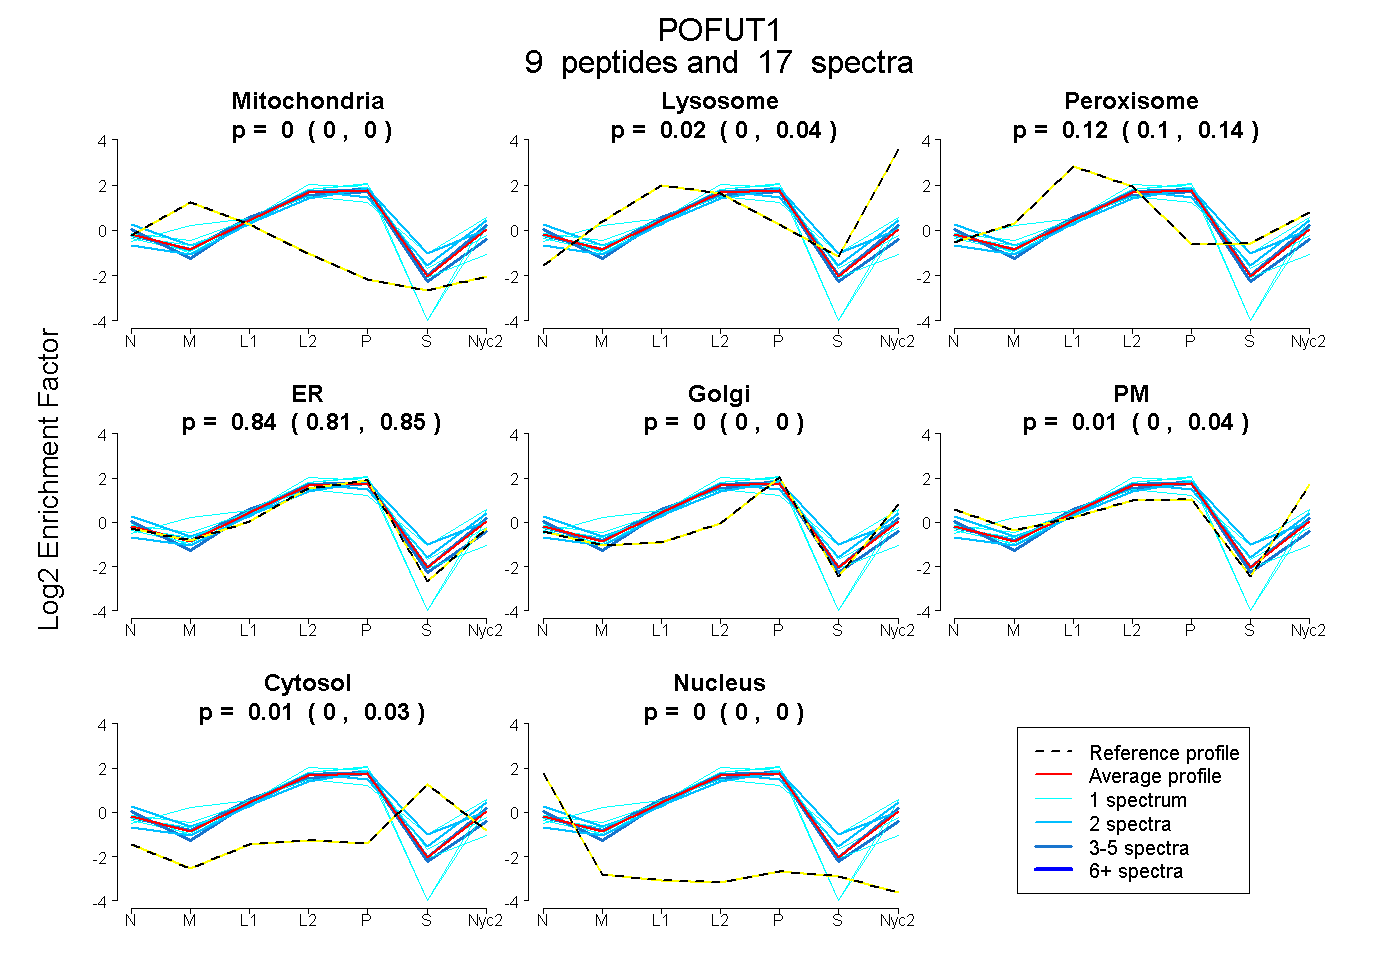
 9
9peptides
spectra
0.000 | 0.000
0.000 | 0.038
0.096 | 0.135
0.808 | 0.855
0.000 | 0.000
0.000 | 0.039
0.000 | 0.025
0.000 | 0.000
| Plot | Mito | Lyso | Perox | ER | Golgi | PM | Cytosol | Nucleus | |||||
| Expt A |
9 peptides |
17 spectra |
|
0.000 0.000 | 0.000 |
0.020 0.000 | 0.038 |
0.117 0.096 | 0.135 |
0.836 0.808 | 0.855 |
0.000 0.000 | 0.000 |
0.013 0.000 | 0.039 |
0.014 0.000 | 0.025 |
0.000 0.000 | 0.000 |
| 4 spectra, VISLEDFMEK | 0.000 | 0.000 | 0.094 | 0.772 | 0.000 | 0.112 | 0.022 | 0.000 | ||
| 2 spectra, YMVWSDEMVR | 0.000 | 0.101 | 0.050 | 0.693 | 0.000 | 0.000 | 0.156 | 0.000 | ||
| 2 spectra, IGSDWK | 0.000 | 0.000 | 0.147 | 0.549 | 0.000 | 0.264 | 0.040 | 0.000 | ||
| 1 spectrum, VAYCFEVAAQR | 0.000 | 0.000 | 0.056 | 0.930 | 0.000 | 0.000 | 0.014 | 0.000 | ||
| 1 spectrum, NACAMLK | 0.000 | 0.000 | 0.138 | 0.822 | 0.000 | 0.000 | 0.040 | 0.000 | ||
| 4 spectra, DGTAGSHFMASPQCVGYSR | 0.000 | 0.000 | 0.120 | 0.870 | 0.000 | 0.000 | 0.009 | 0.001 | ||
| 1 spectrum, EQWIQR | 0.000 | 0.000 | 0.000 | 0.786 | 0.000 | 0.214 | 0.000 | 0.000 | ||
| 1 spectrum, LEPLQAYHR | 0.000 | 0.139 | 0.272 | 0.419 | 0.117 | 0.000 | 0.053 | 0.000 | ||
| 1 spectrum, FGNQADHFLGSLAFAK | 0.000 | 0.000 | 0.000 | 0.902 | 0.000 | 0.098 | 0.000 | 0.000 |
| Plot | Lyso | Other | |||||||||||
| Expt C |
6 peptides |
9 spectra |
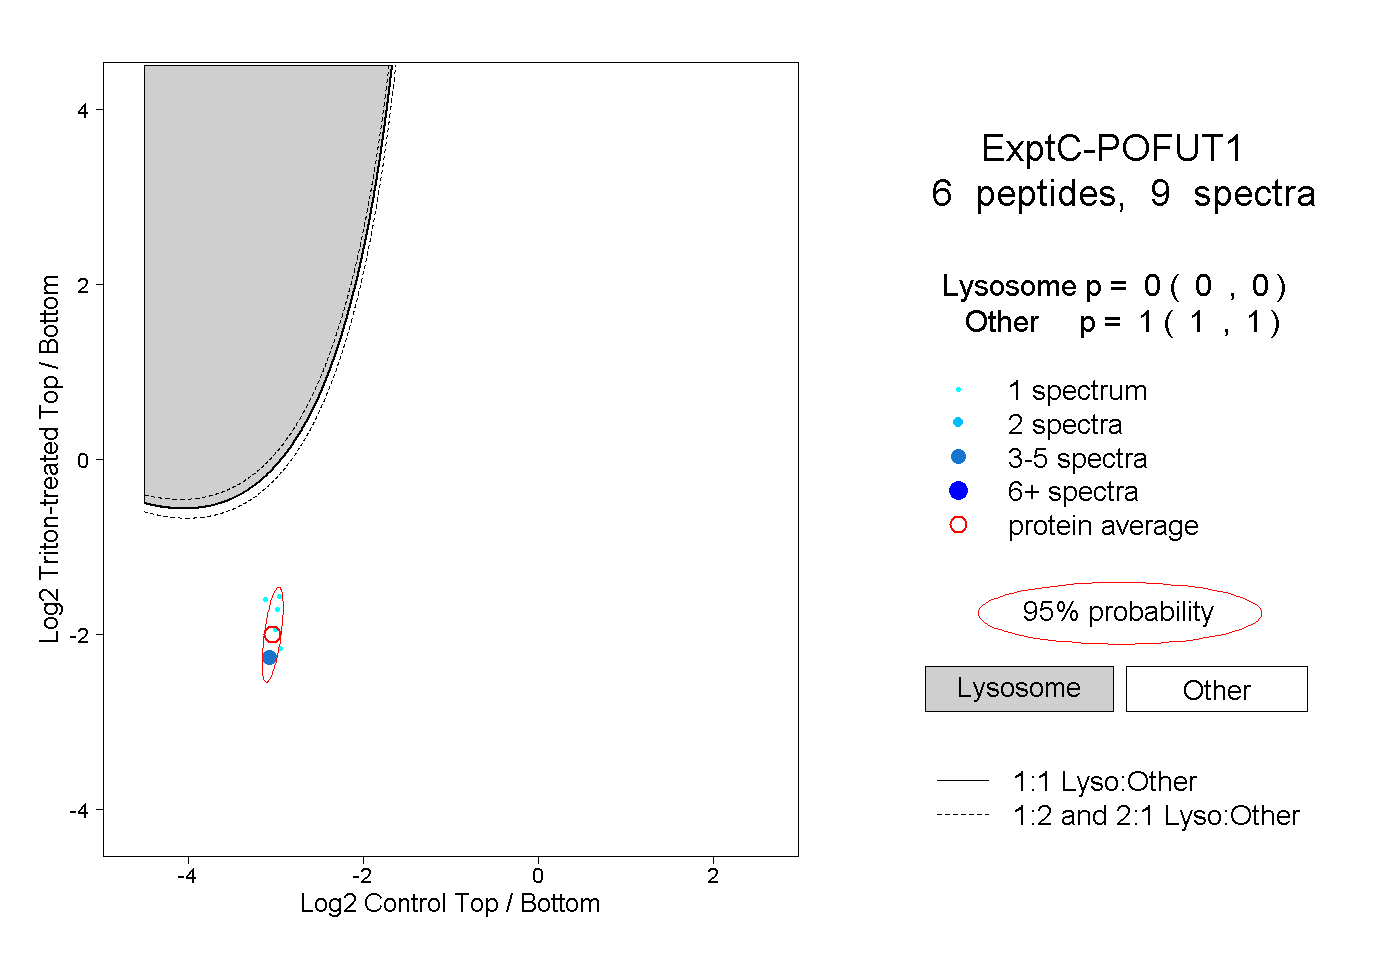 |
0.000 0.000 | 0.000 |
1.000 1.000 | 1.000 |