 3
3peptides
spectra
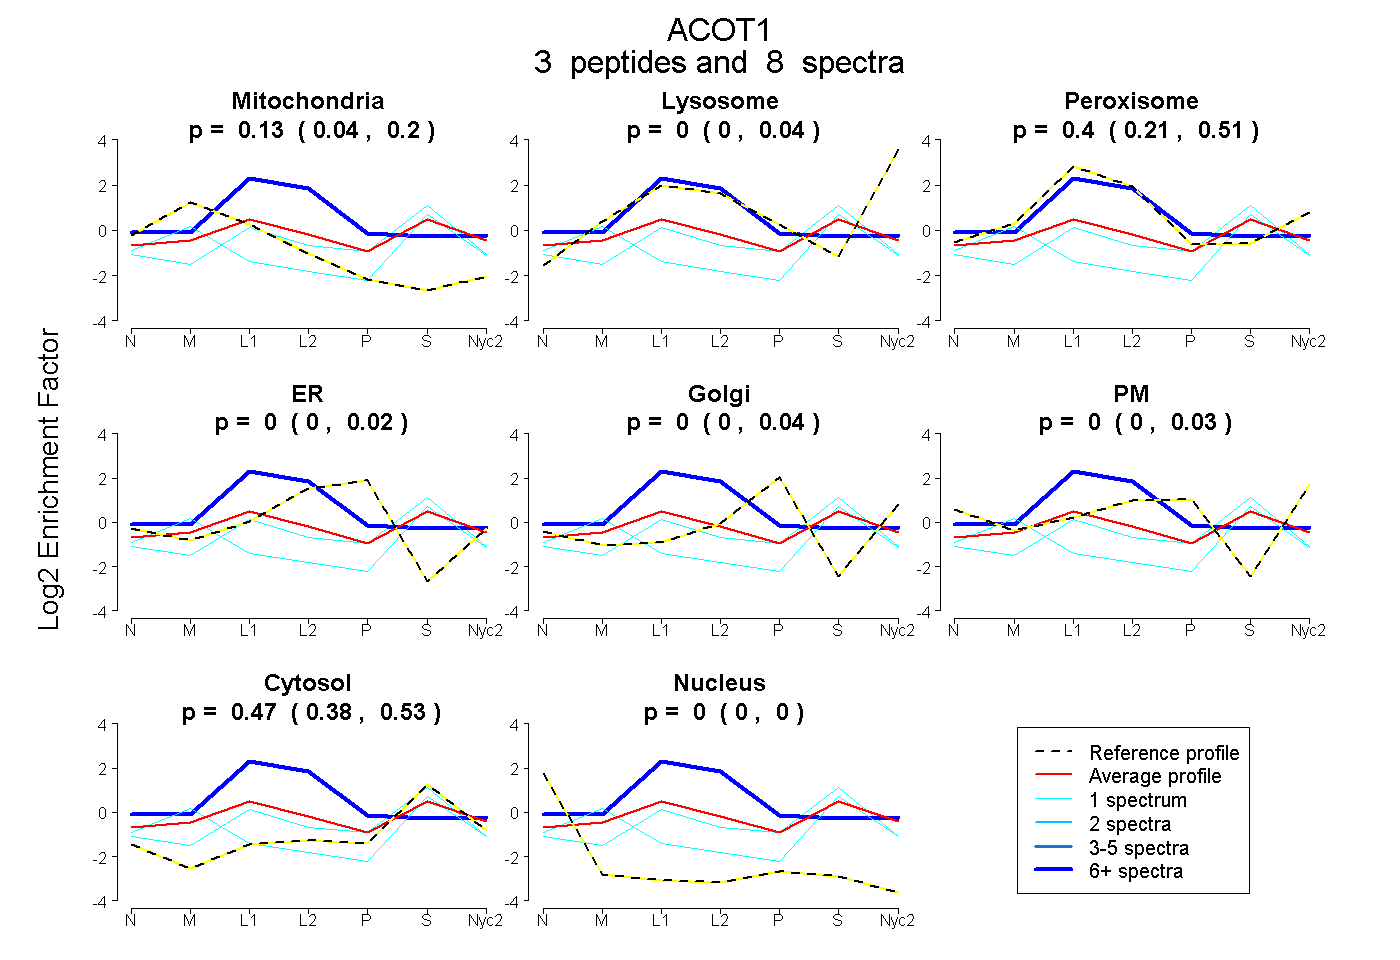
0.042 | 0.204
0.000 | 0.038
0.210 | 0.506
0.000 | 0.024
0.000 | 0.042
0.000 | 0.027
0.379 | 0.528
0.000 | 0.000
1peptide
spectra
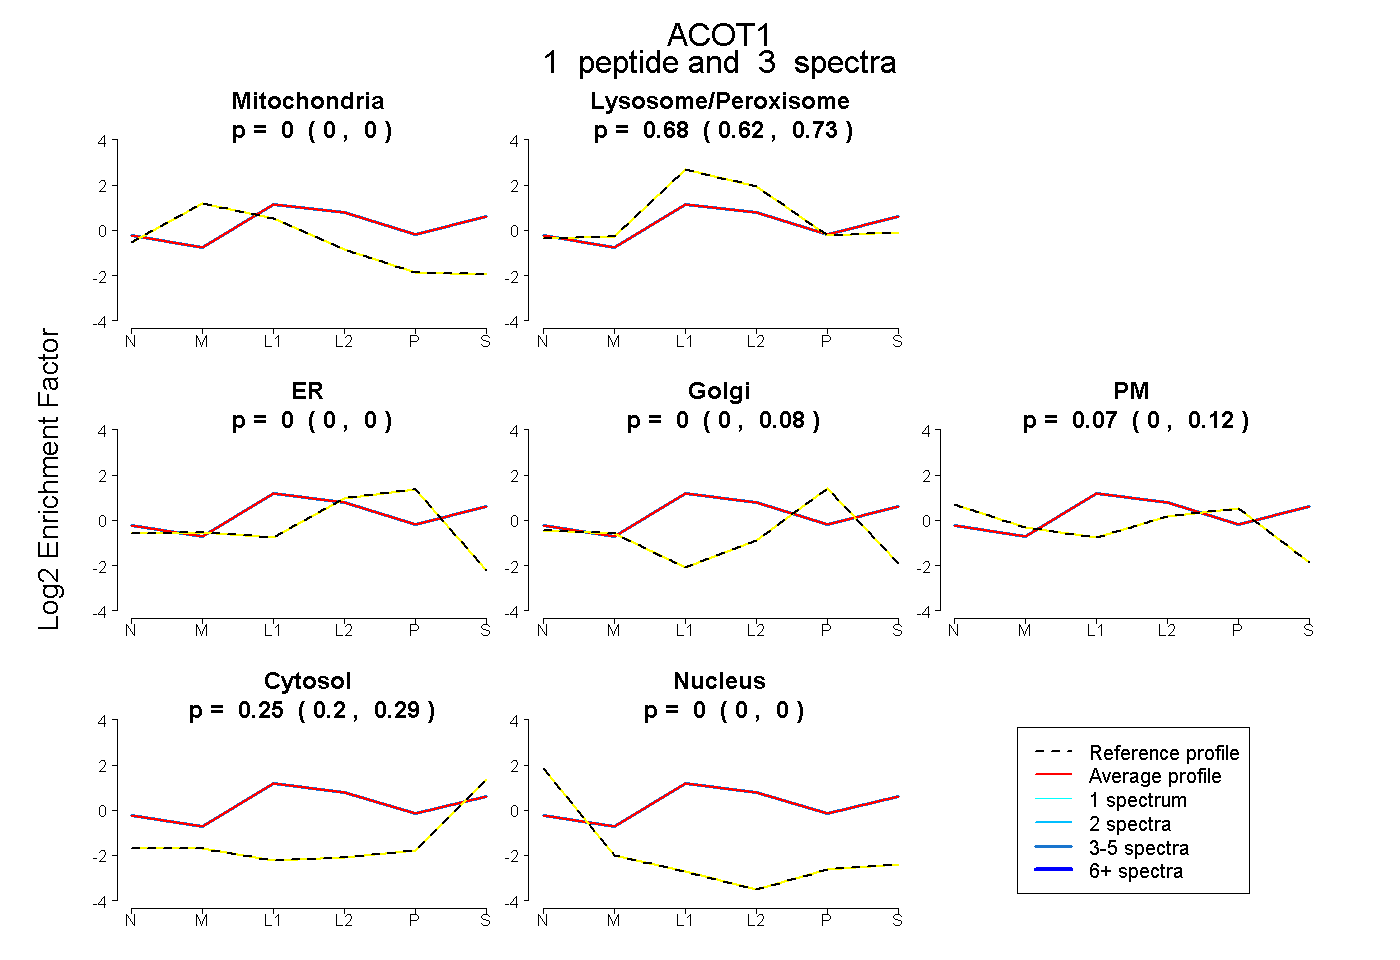
0.000 | 0.000
0.617 | 0.731
0.000 | 0.000
0.000 | 0.079
0.000 | 0.116
0.202 | 0.286
0.000 | 0.000
1peptide
spectra
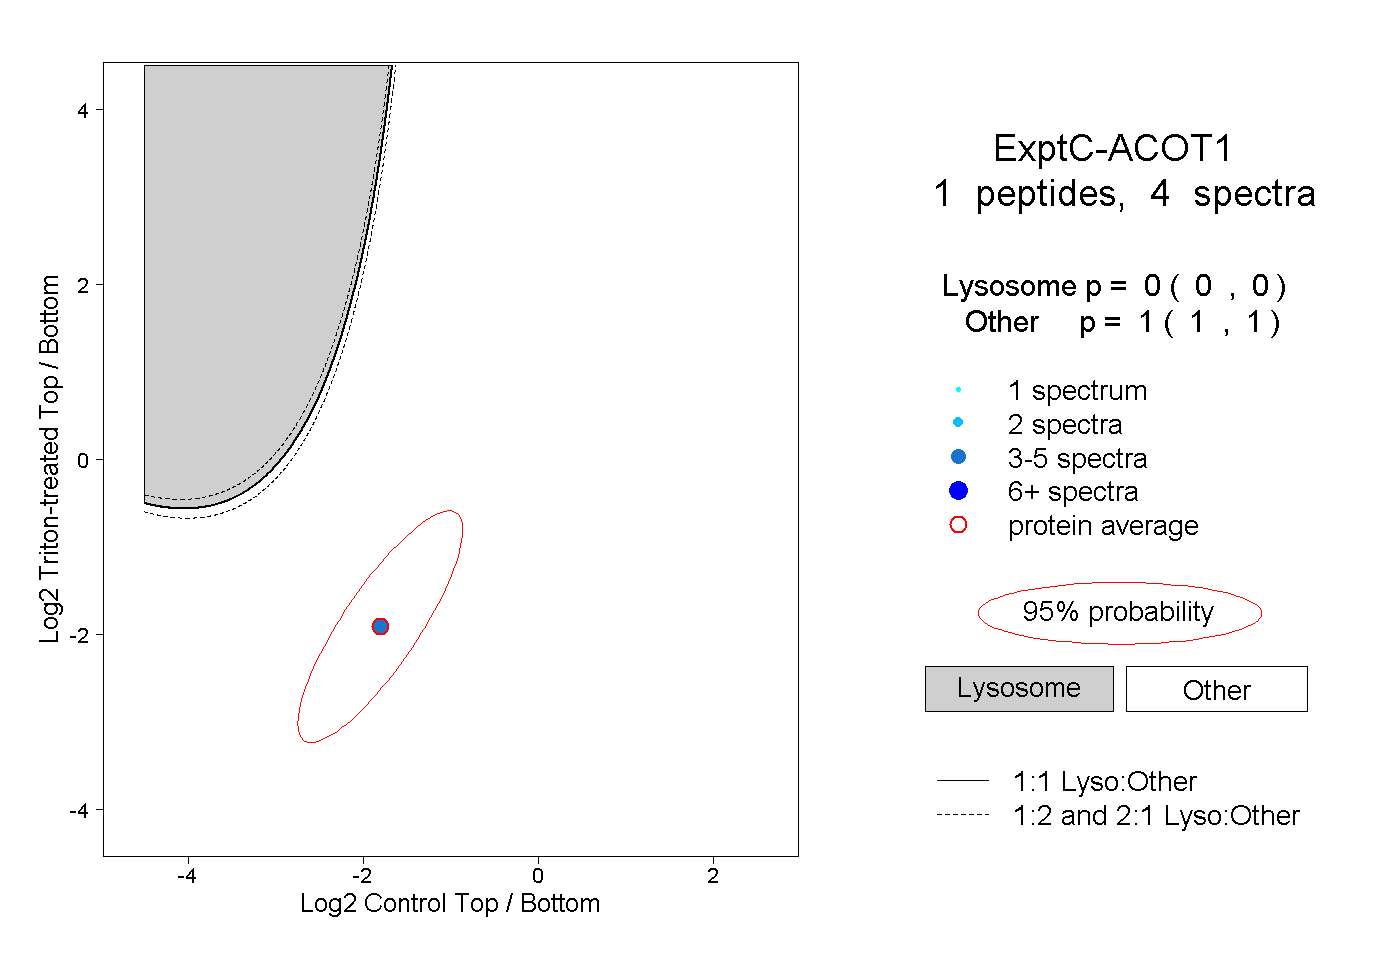
0.000 | 0.000
1.000 | 1.000
1peptide
spectra
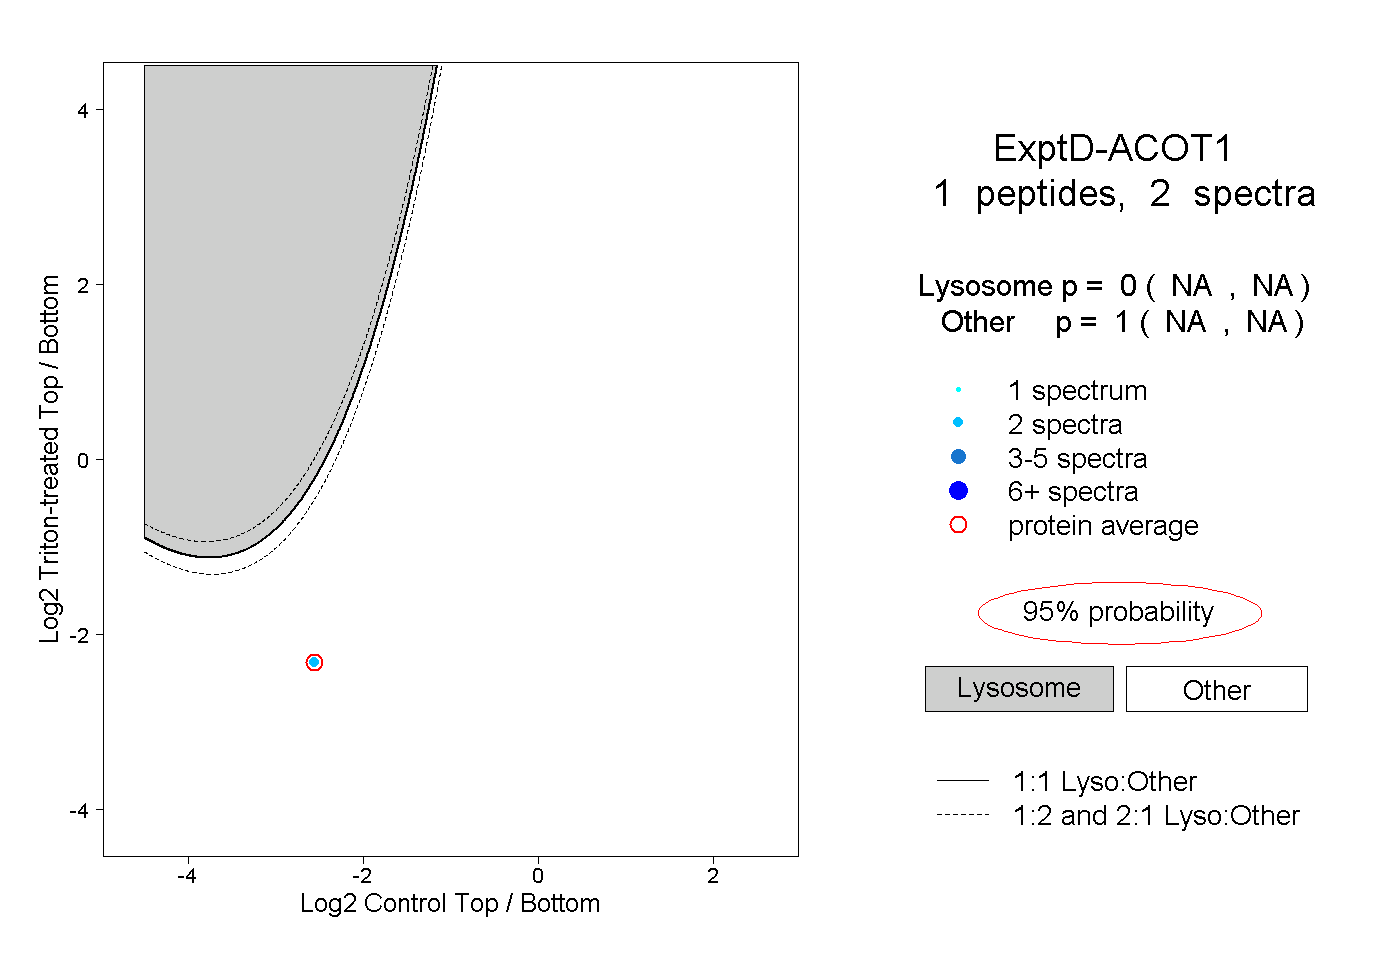
NA | NA
NA | NA