 3
3peptides
spectra
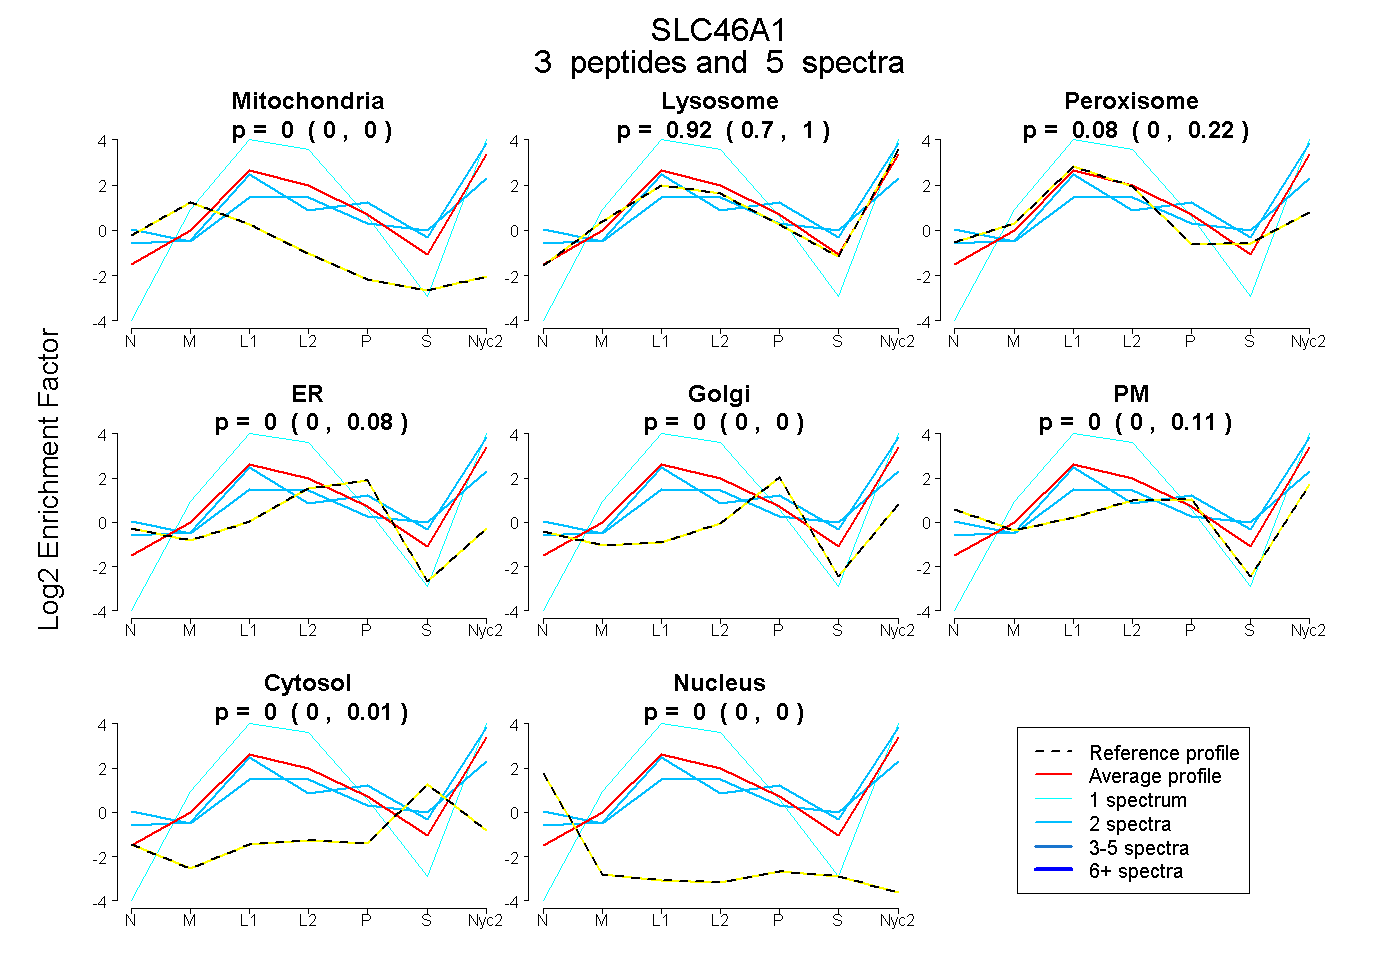
0.000 | 0.000
0.702 | 1.000
0.000 | 0.216
0.000 | 0.077
0.000 | 0.000
0.000 | 0.106
0.000 | 0.012
0.000 | 0.000
2peptides
spectra
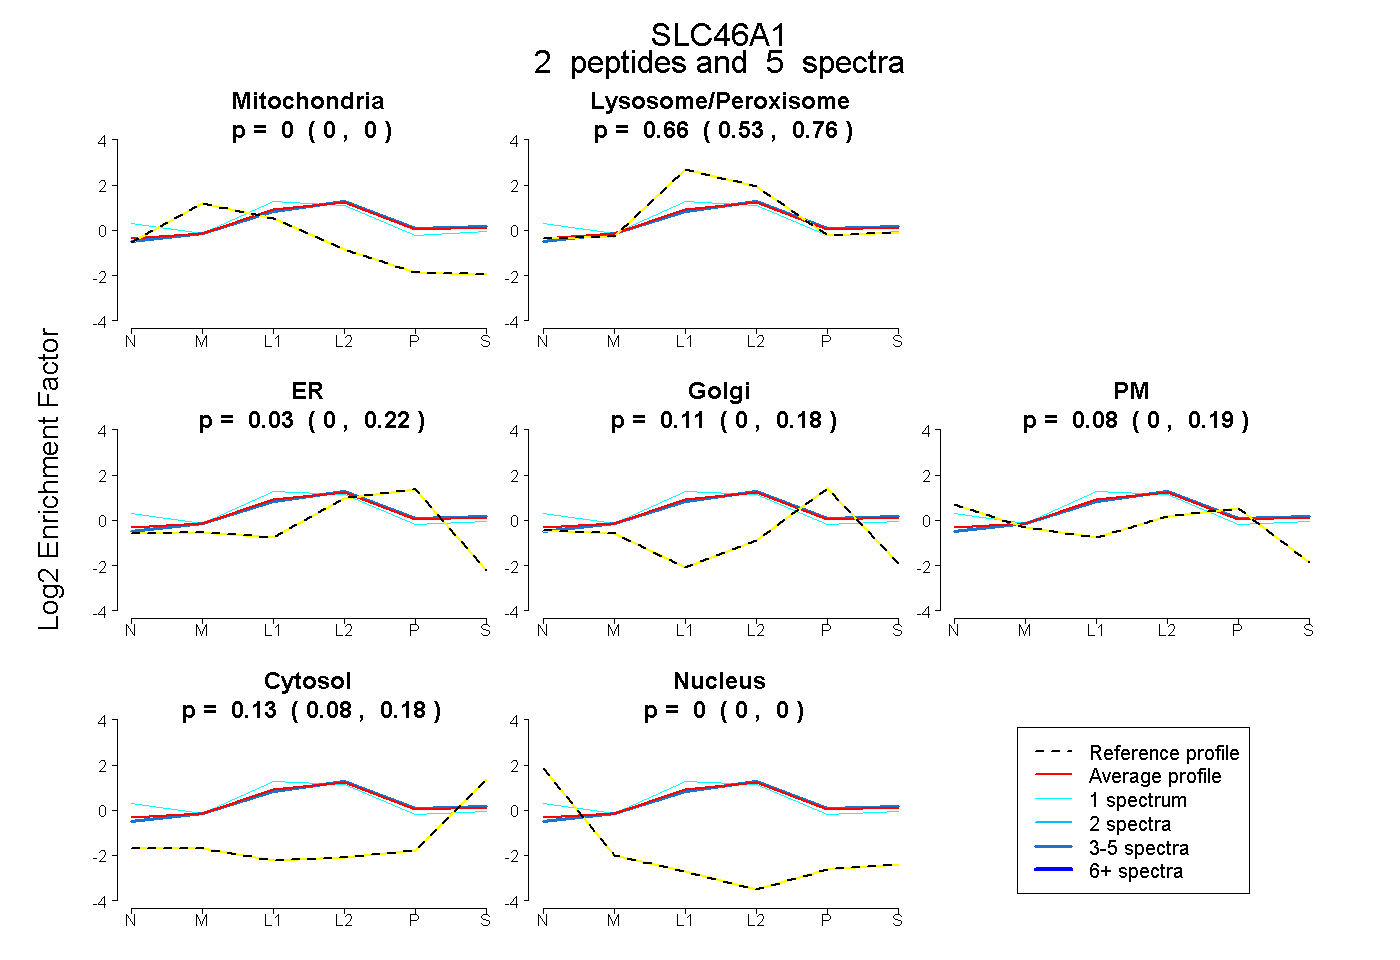
0.000 | 0.000
0.526 | 0.756
0.000 | 0.219
0.000 | 0.179
0.000 | 0.188
0.081 | 0.177
0.000 | 0.000
4peptides
spectra
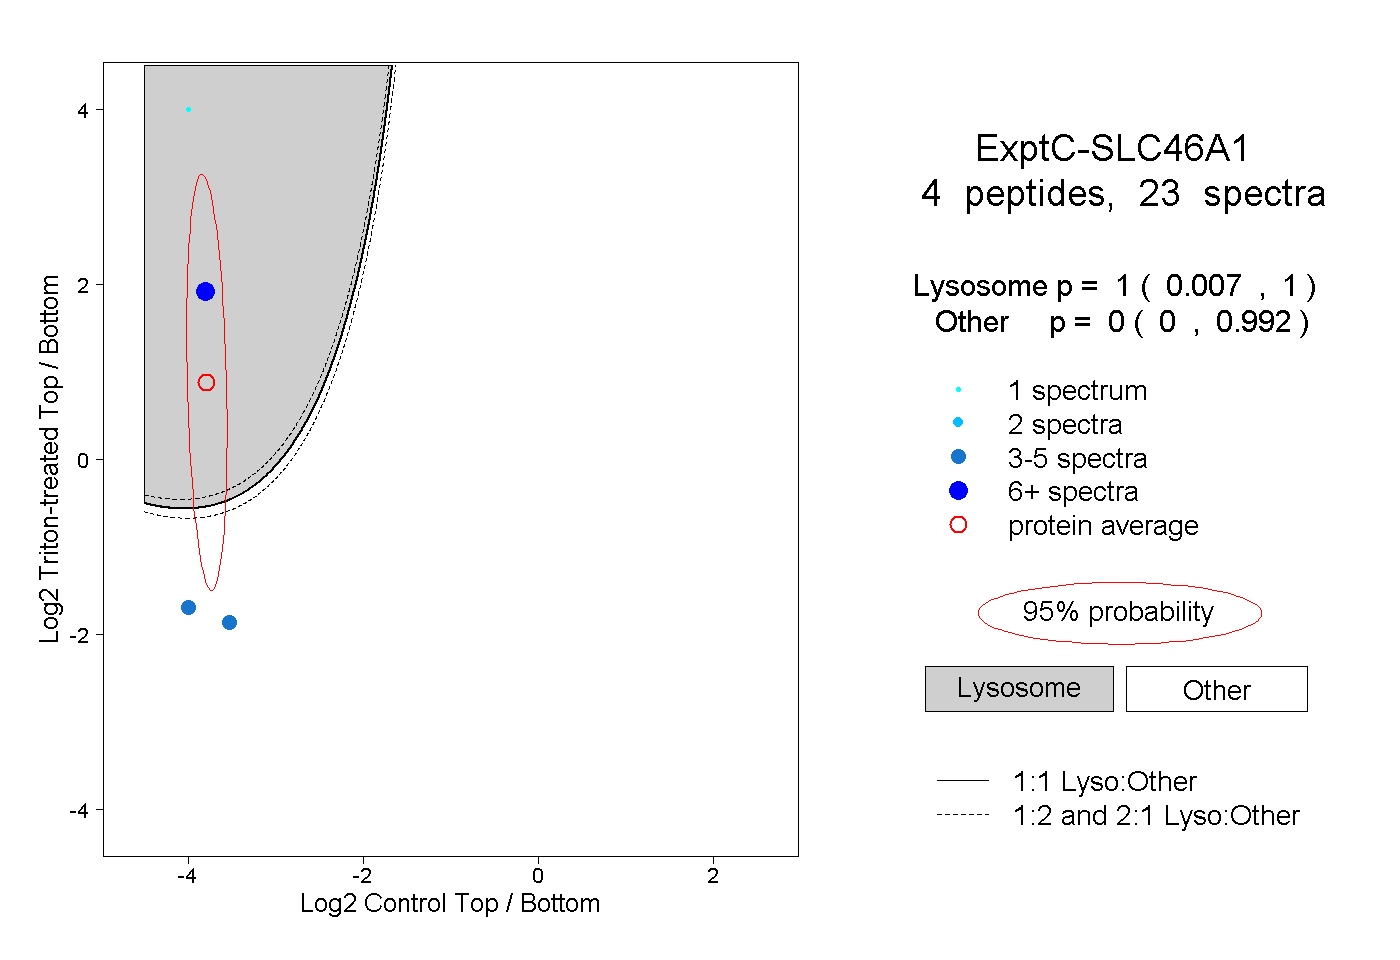
0.007 | 1.000
0.000 | 0.992
2peptides
spectra
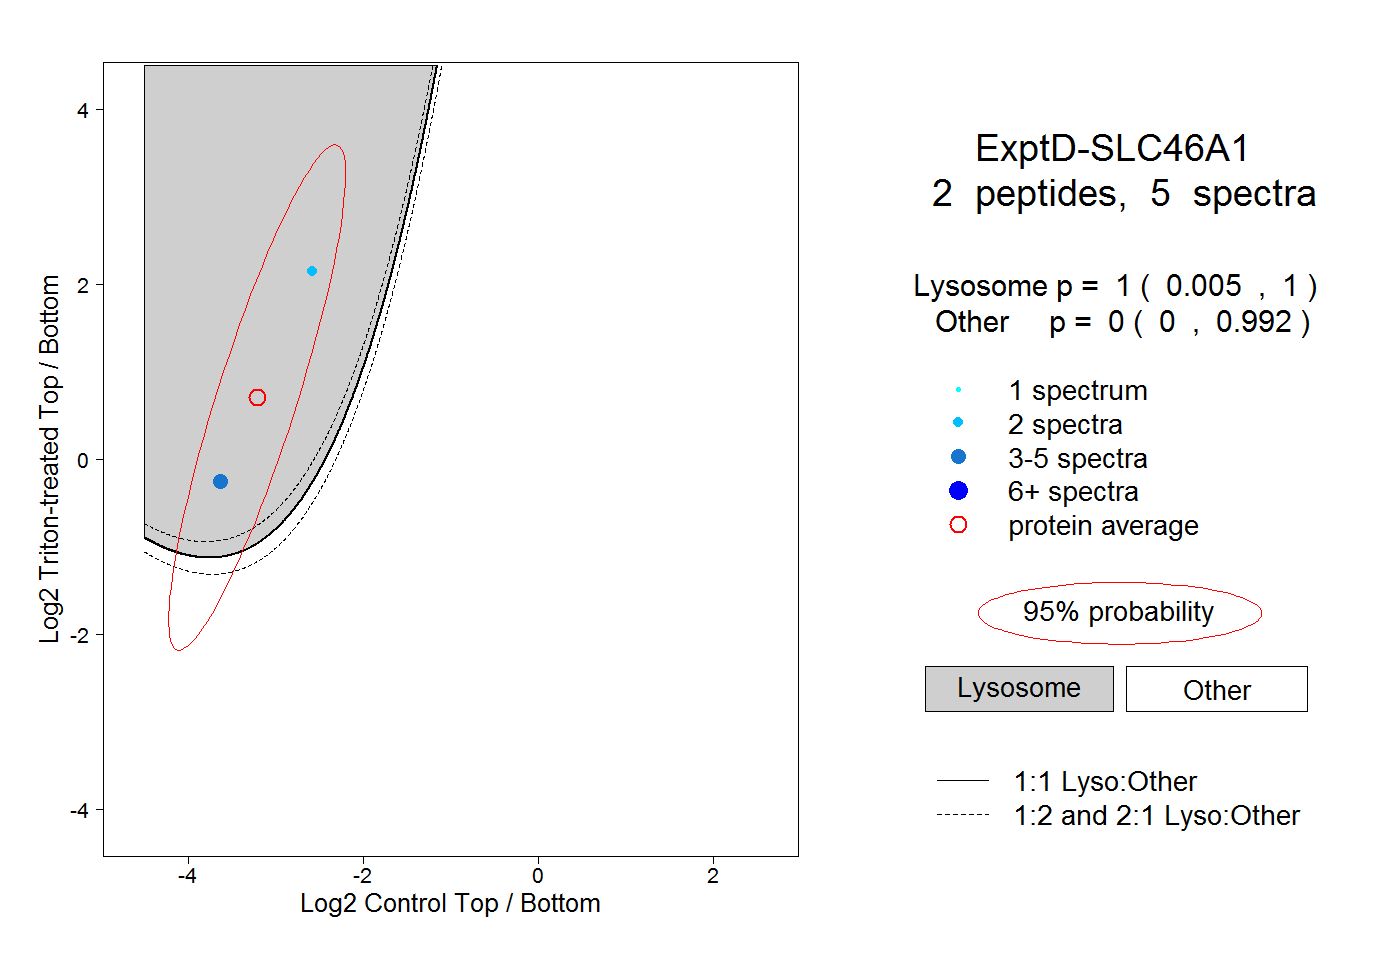
0.005 | 1.000
0.000 | 0.992