 2
2peptides
spectra

0.000 | 0.000
0.000 | 0.000
0.000 | 0.105
0.000 | 0.251
0.032 | 0.372
0.000 | 0.225
0.476 | 0.584
0.000 | 0.099
1peptide
spectrum
NA | NA
NA | NA
| Plot | Mito | Lyso | Perox | ER | Golgi | PM | Cytosol | Nucleus | |||||
| Expt A |
2 peptides |
4 spectra |
|
0.000 0.000 | 0.000 |
0.000 0.000 | 0.000 |
0.084 0.000 | 0.105 |
0.000 0.000 | 0.251 |
0.349 0.032 | 0.372 |
0.000 0.000 | 0.225 |
0.512 0.476 | 0.584 |
0.055 0.000 | 0.099 |
||
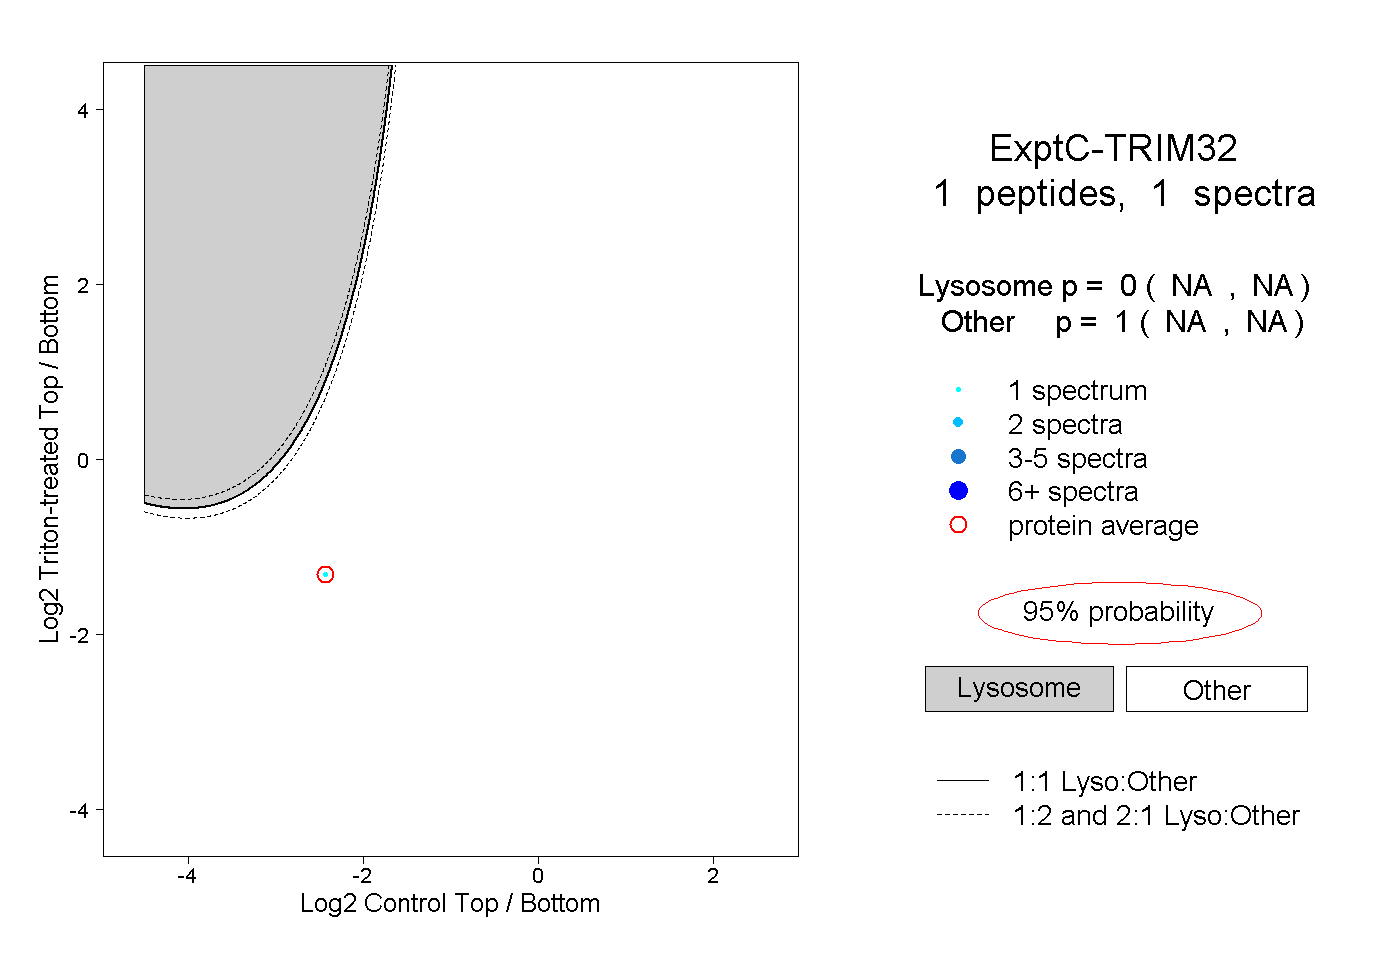
| Plot | Lyso | Other | |||||||||||
| Expt C |
1 peptide |
1 spectrum |
|
0.000 NA | NA |
1.000 NA | NA |