 2
2peptides
spectra

0.000 | 0.121
0.000 | 0.705
0.000 | 0.559
0.000 | 0.000
0.000 | 0.260
0.000 | 0.185
0.046 | 0.247
0.000 | 0.000
1peptide
spectra
0.000 | 0.000
1.000 | 1.000
| Plot | Mito | Lyso | Perox | ER | Golgi | PM | Cytosol | Nucleus | |||||
| Expt A |
2 peptides |
4 spectra |
|
0.023 0.000 | 0.121 |
0.409 0.000 | 0.705 |
0.248 0.000 | 0.559 |
0.000 0.000 | 0.000 |
0.162 0.000 | 0.260 |
0.000 0.000 | 0.185 |
0.158 0.046 | 0.247 |
0.000 0.000 | 0.000 |
||
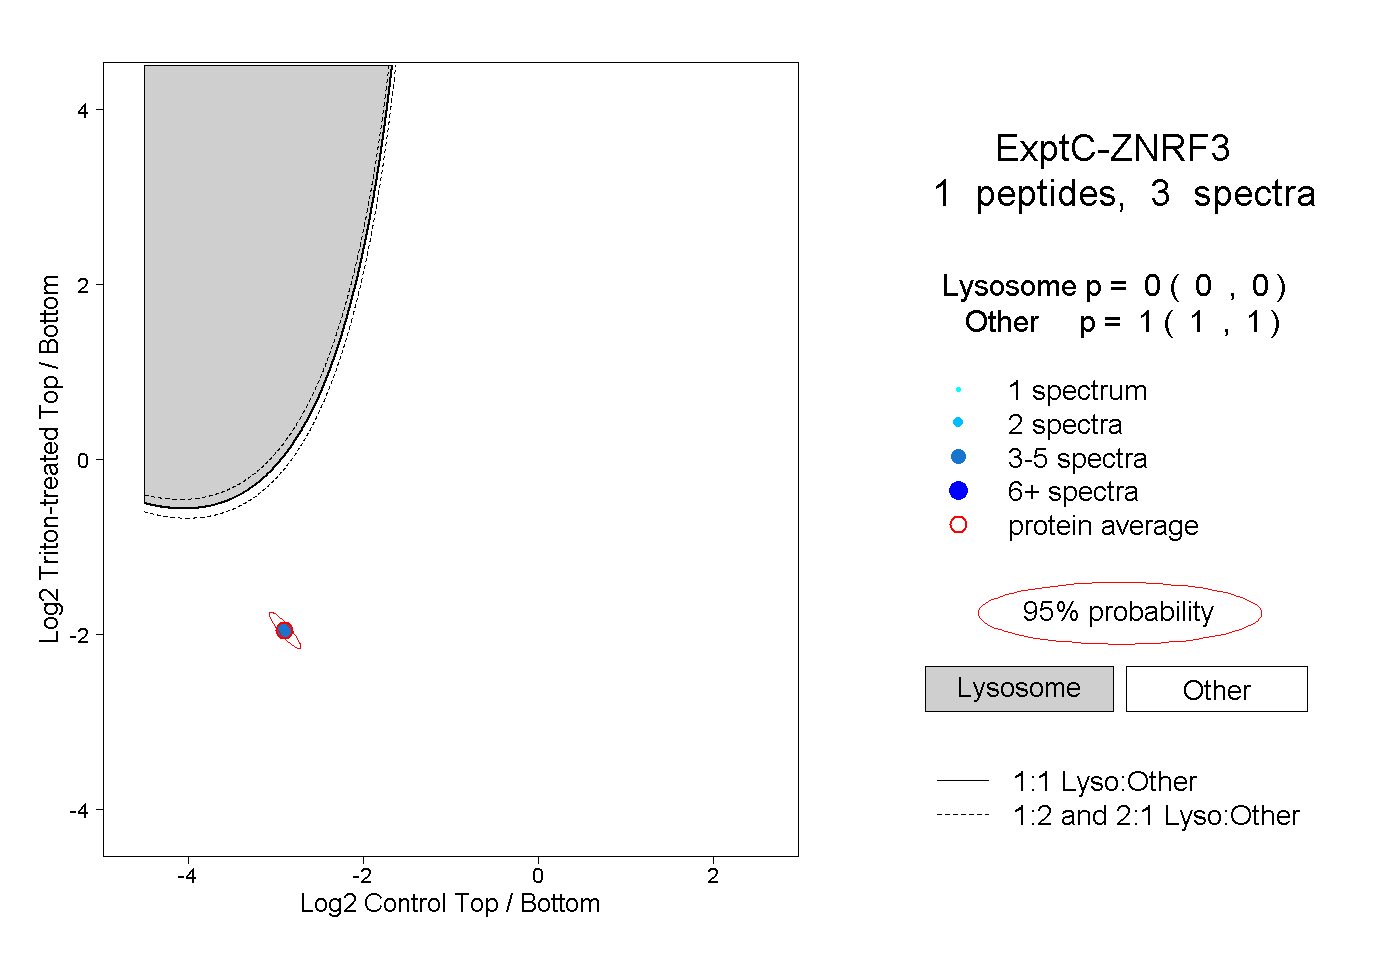
| Plot | Lyso | Other | |||||||||||
| Expt C |
1 peptide |
3 spectra |
|
0.000 0.000 | 0.000 |
1.000 1.000 | 1.000 |