 33
33peptides
spectra
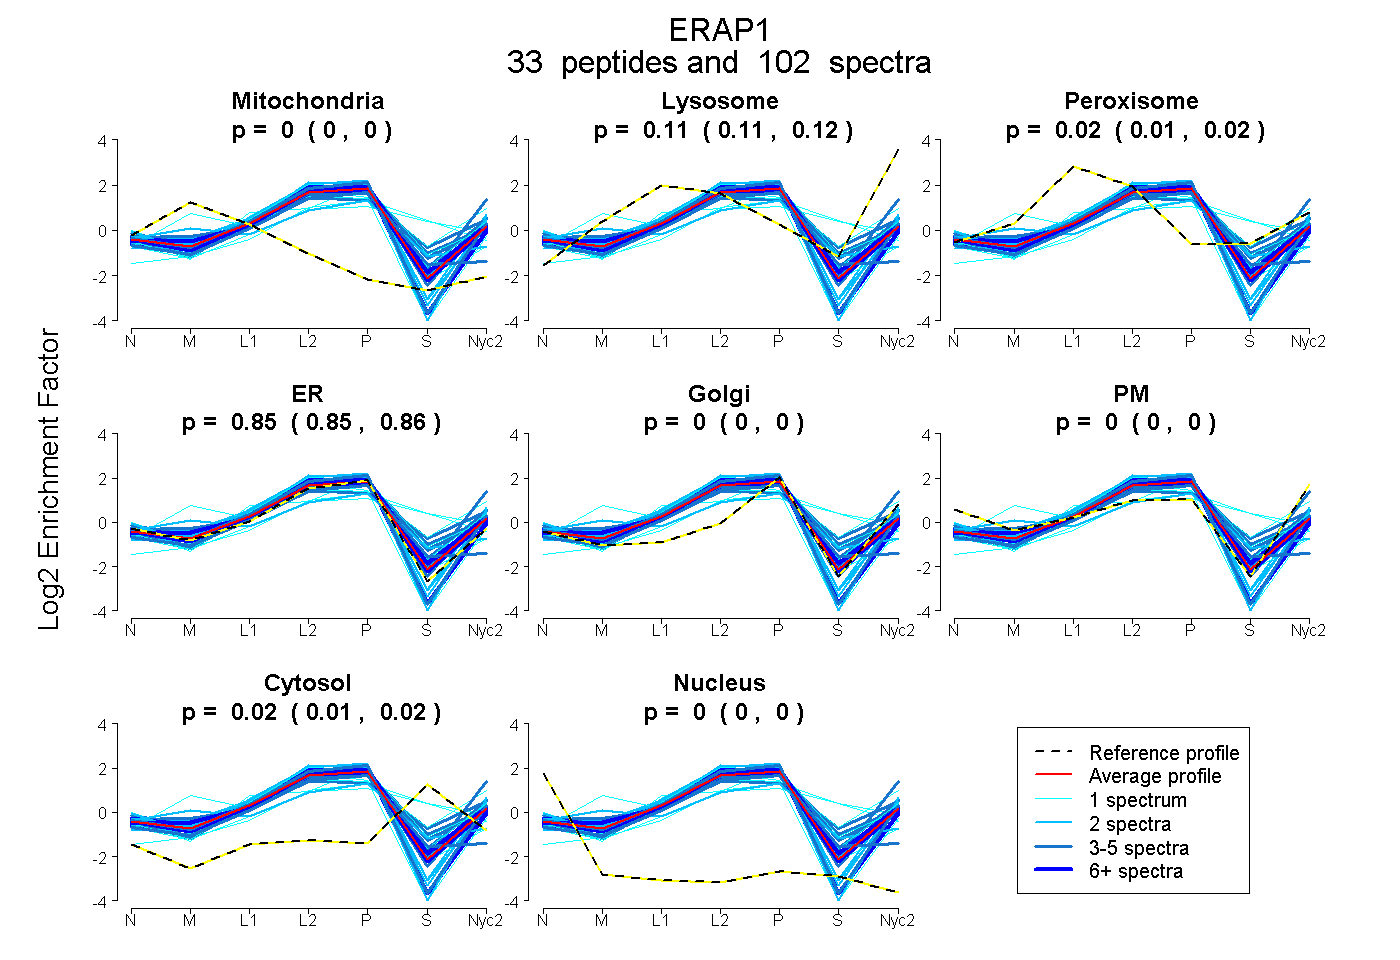
0.000 | 0.000
0.109 | 0.119
0.013 | 0.022
0.846 | 0.856
0.000 | 0.000
0.000 | 0.000
0.013 | 0.019
0.000 | 0.000
10peptides
spectra
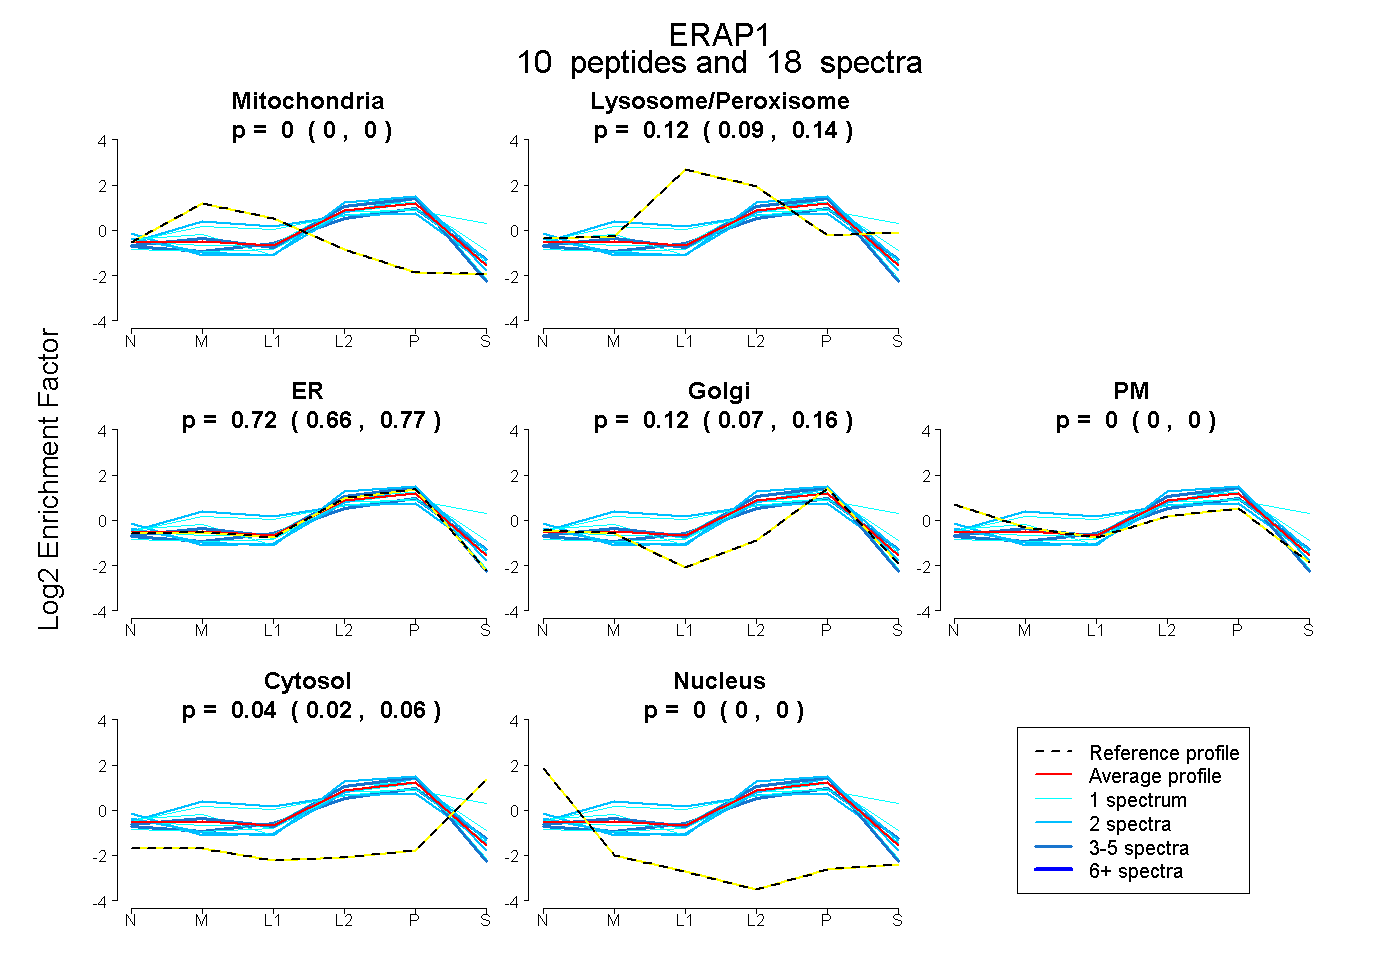
0.000 | 0.000
0.094 | 0.141
0.662 | 0.772
0.069 | 0.156
0.000 | 0.000
0.023 | 0.056
0.000 | 0.000
21peptides
spectra
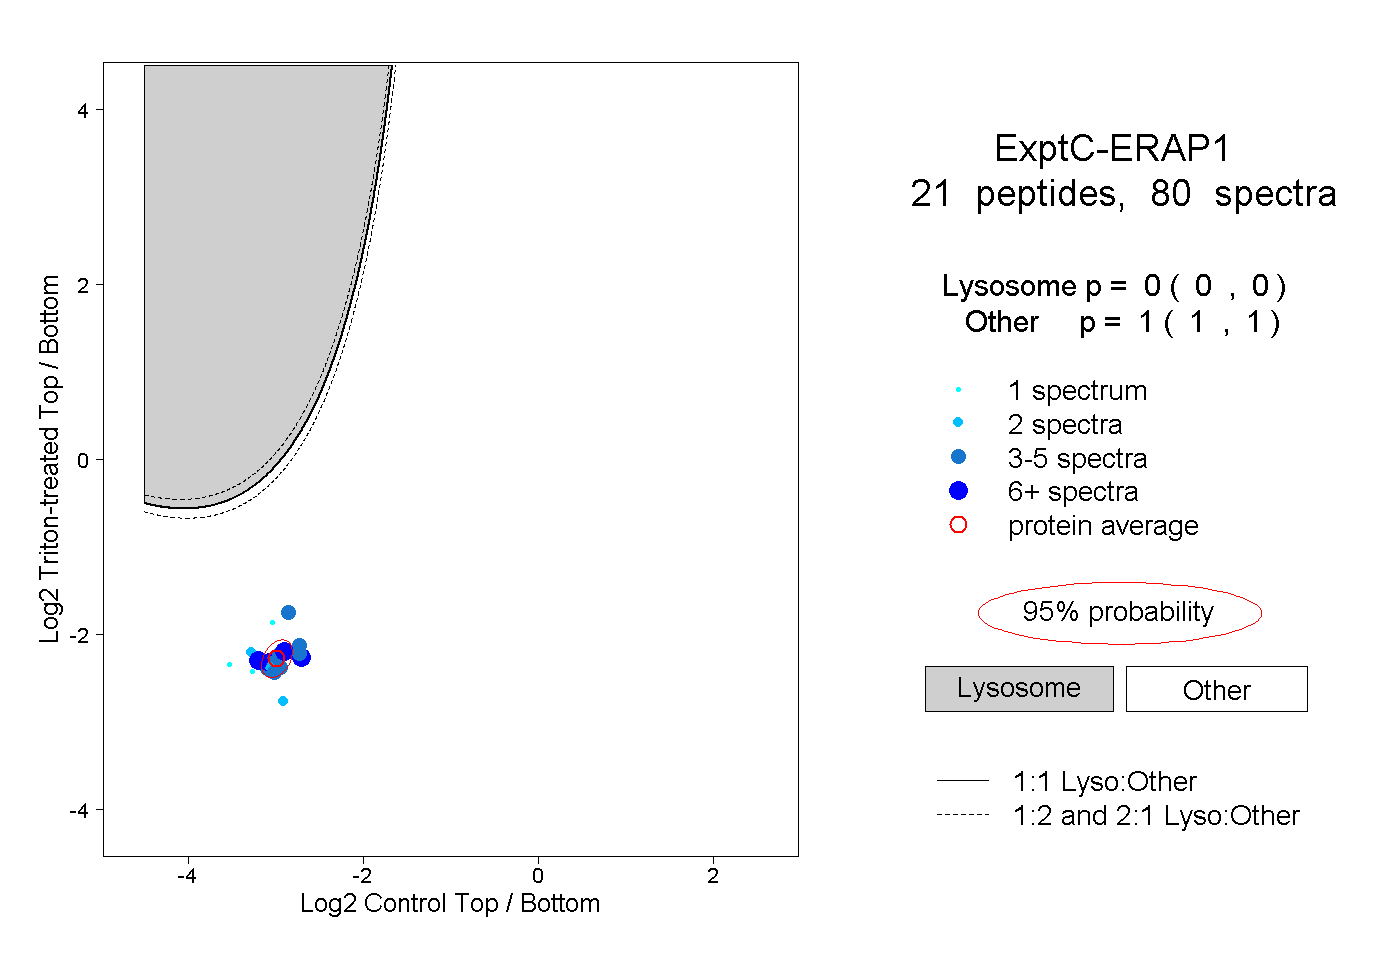
0.000 | 0.000
1.000 | 1.000
7peptides
spectra
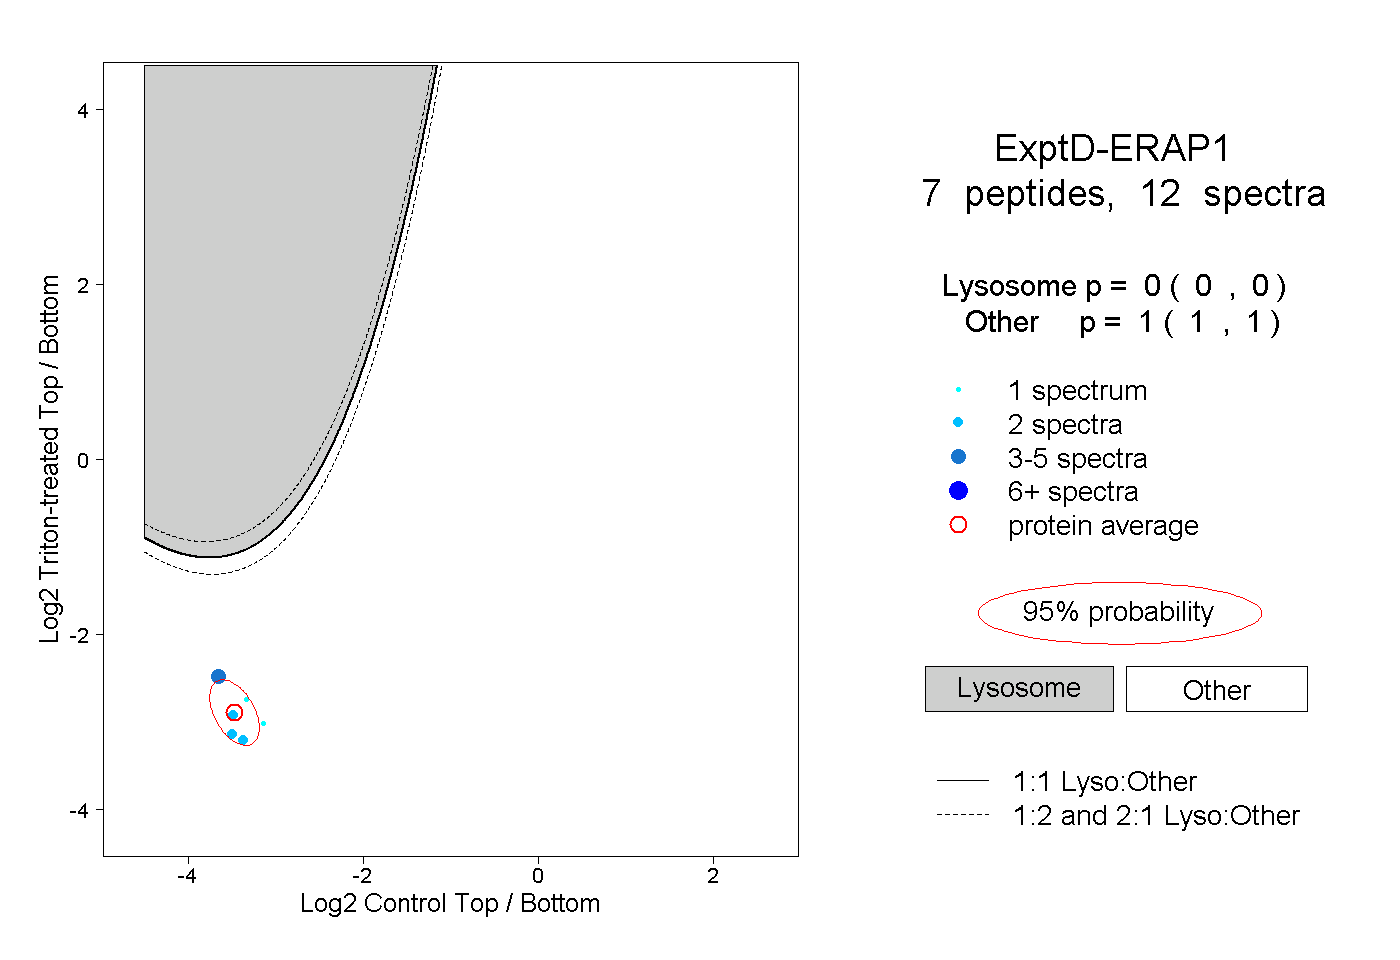
0.000 | 0.000
1.000 | 1.000