 28
28peptides
spectra
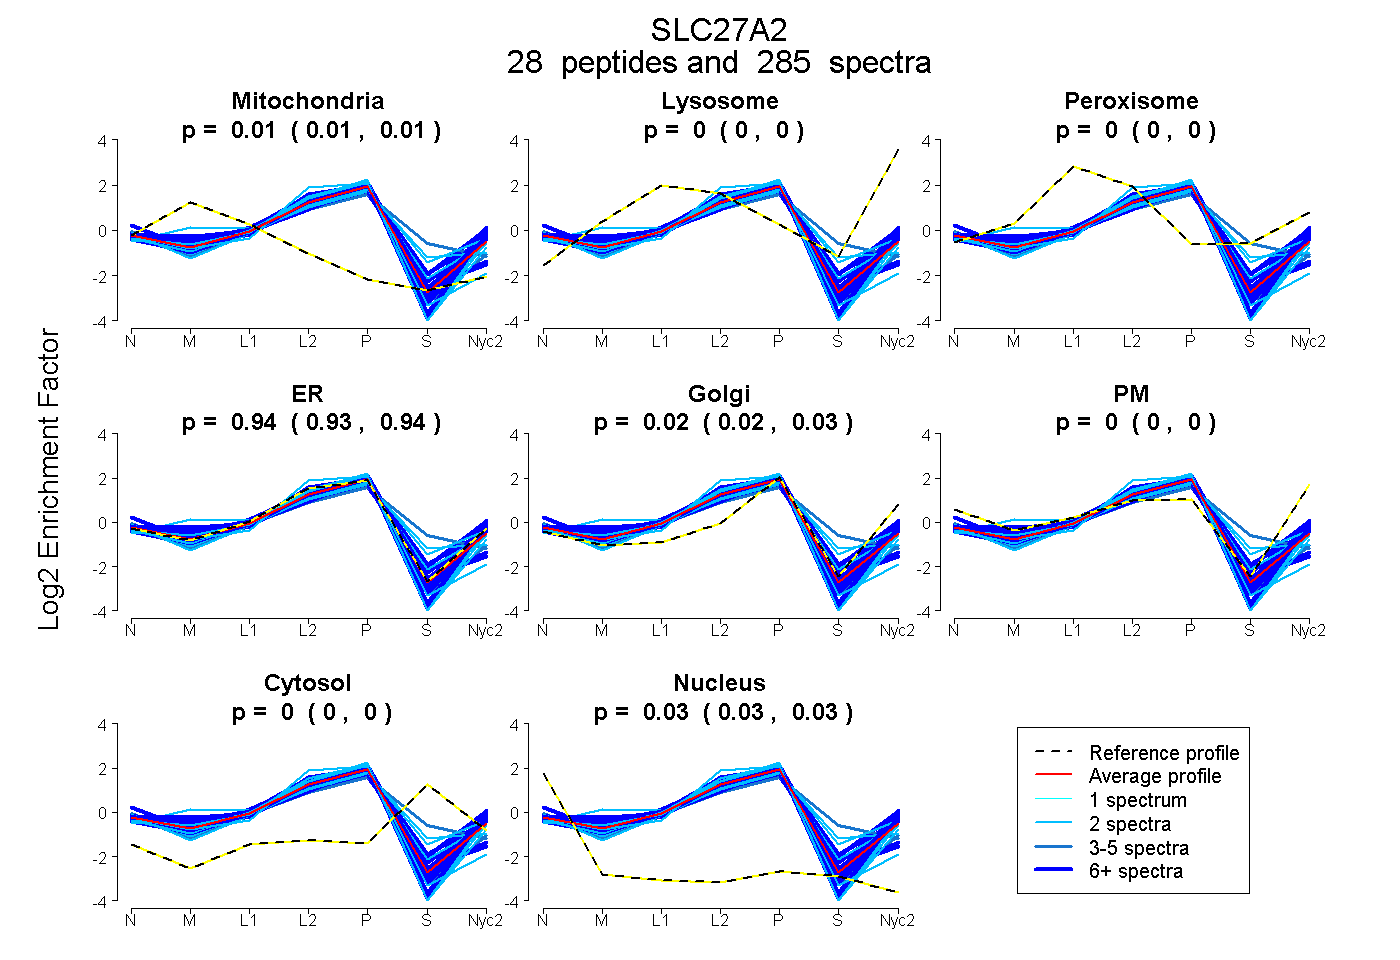
0.009 | 0.011
0.000 | 0.000
0.000 | 0.000
0.934 | 0.941
0.021 | 0.028
0.000 | 0.000
0.000 | 0.000
0.026 | 0.029
24peptides
spectra
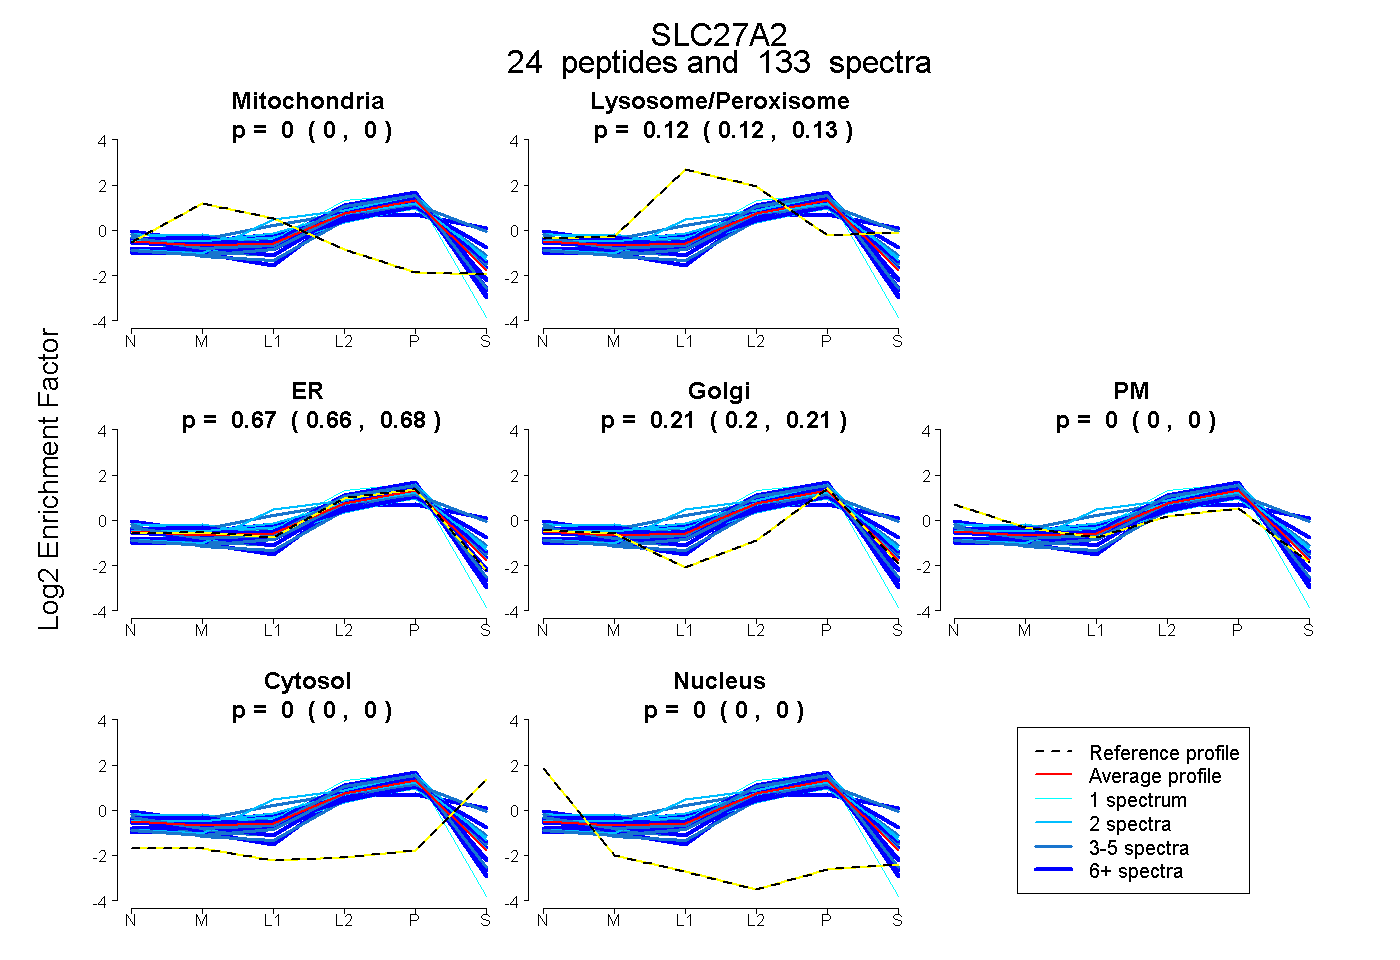
0.000 | 0.000
0.116 | 0.127
0.661 | 0.684
0.196 | 0.210
0.000 | 0.000
0.000 | 0.004
0.000 | 0.000
27peptides
spectra
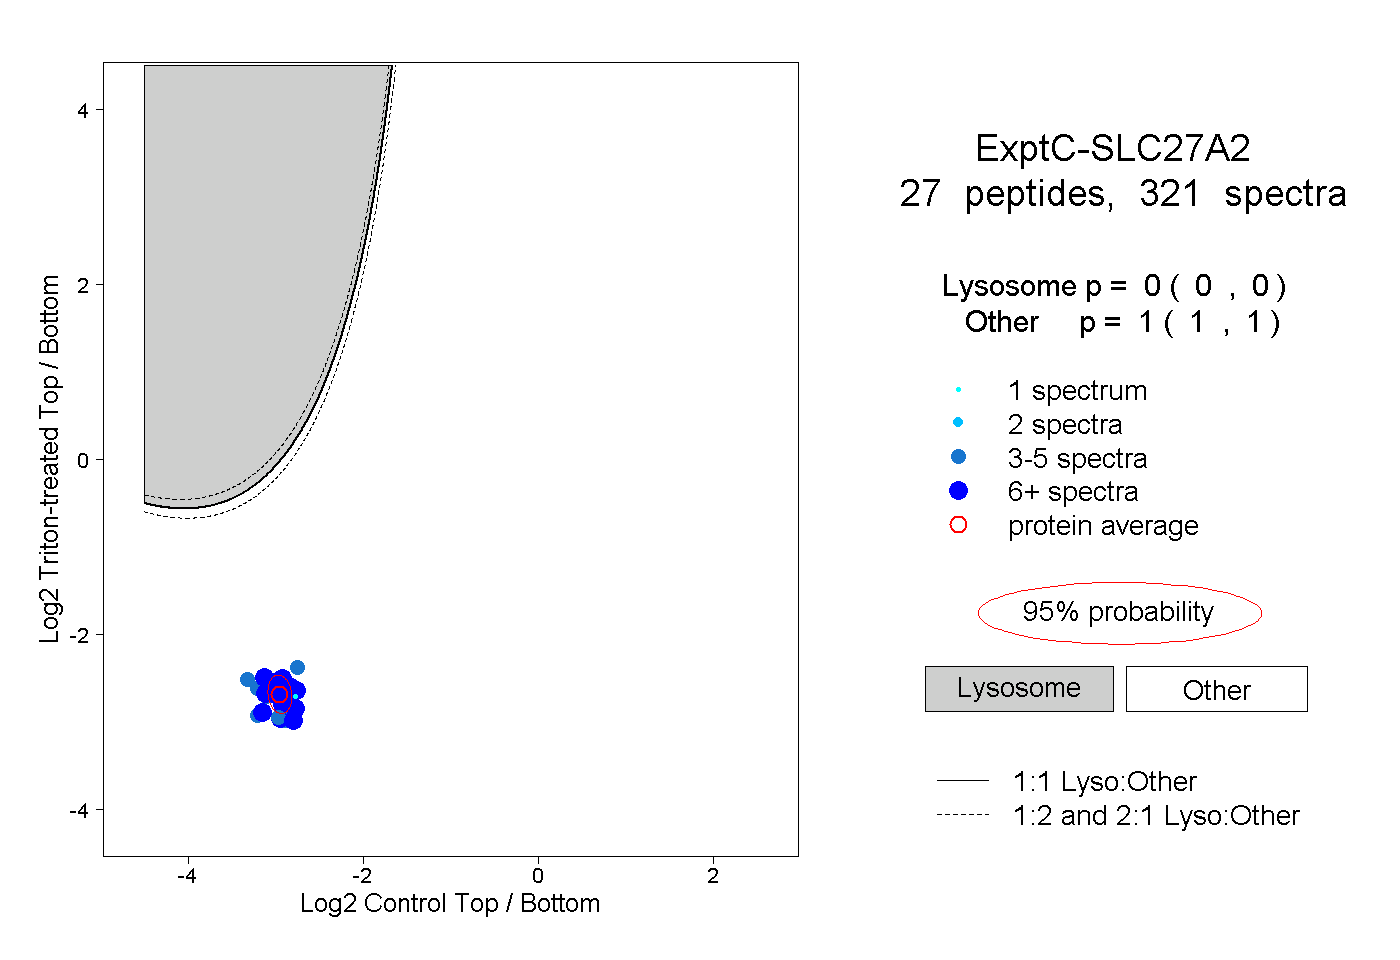
0.000 | 0.000
1.000 | 1.000
13peptides
spectra
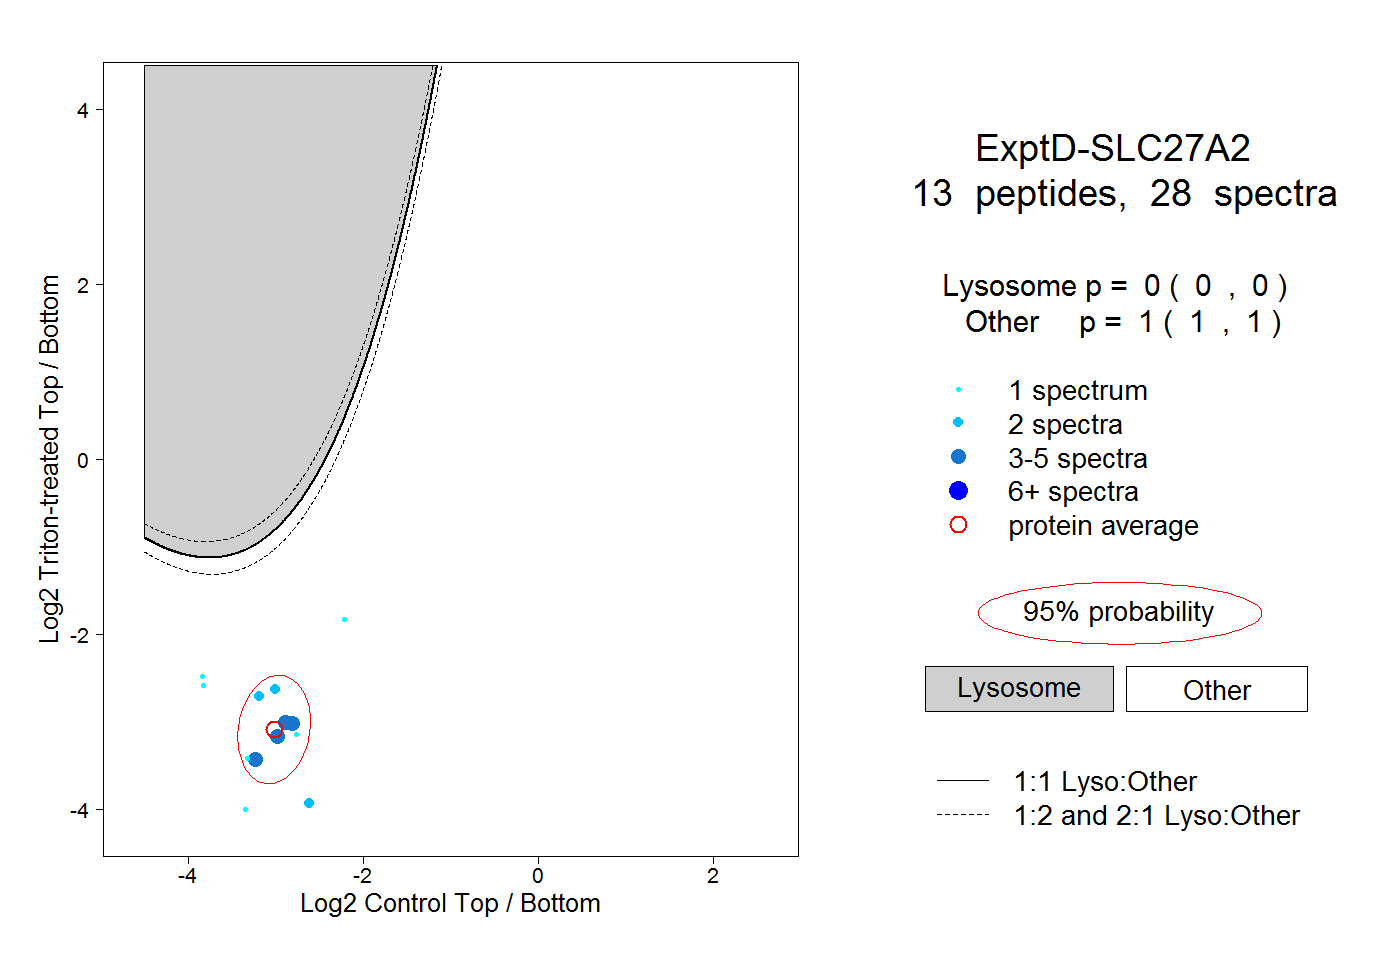
0.000 | 0.000
1.000 | 1.000