 2
2peptides
spectra
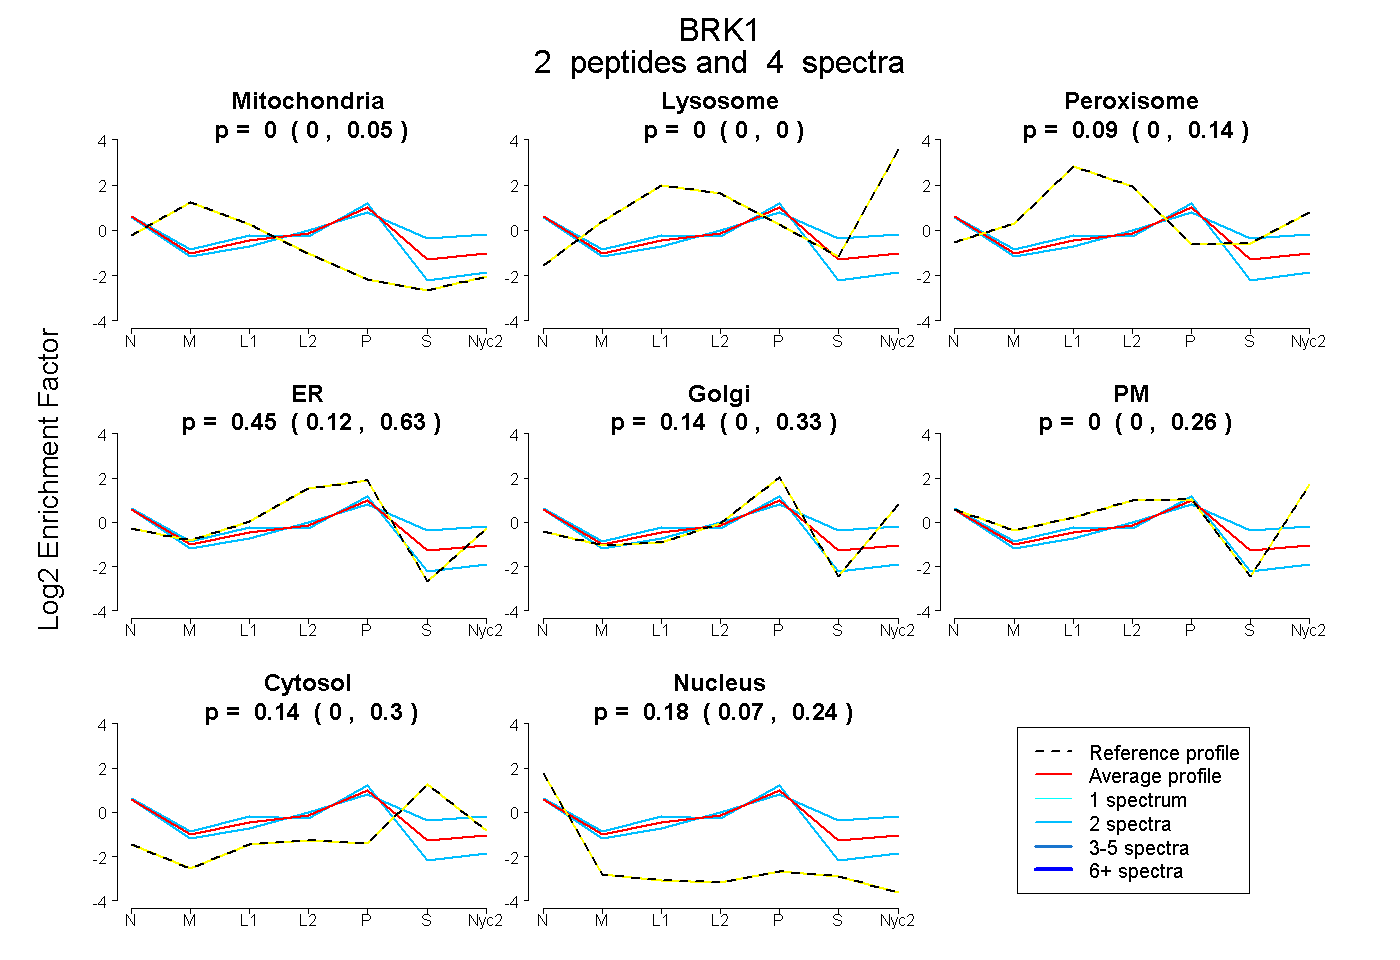
0.000 | 0.051
0.000 | 0.000
0.000 | 0.139
0.119 | 0.630
0.000 | 0.326
0.000 | 0.256
0.000 | 0.297
0.065 | 0.238
| Plot | Mito | Lyso | Perox | ER | Golgi | PM | Cytosol | Nucleus | |||||
| Expt A |
2 peptides |
4 spectra |
|
0.000 0.000 | 0.051 |
0.000 0.000 | 0.000 |
0.091 0.000 | 0.139 |
0.451 0.119 | 0.630 |
0.141 0.000 | 0.326 |
0.000 0.000 | 0.256 |
0.140 0.000 | 0.297 |
0.179 0.065 | 0.238 |
| 2 spectra, EYIEIITSSIK | 0.095 | 0.000 | 0.000 | 0.671 | 0.000 | 0.000 | 0.000 | 0.235 | ||
| 2 spectra, EIHQDWANR | 0.000 | 0.000 | 0.000 | 0.222 | 0.023 | 0.337 | 0.377 | 0.040 |
| Plot | Lyso | Other | |||||||||||
| Expt C |
1 peptide |
2 spectra |
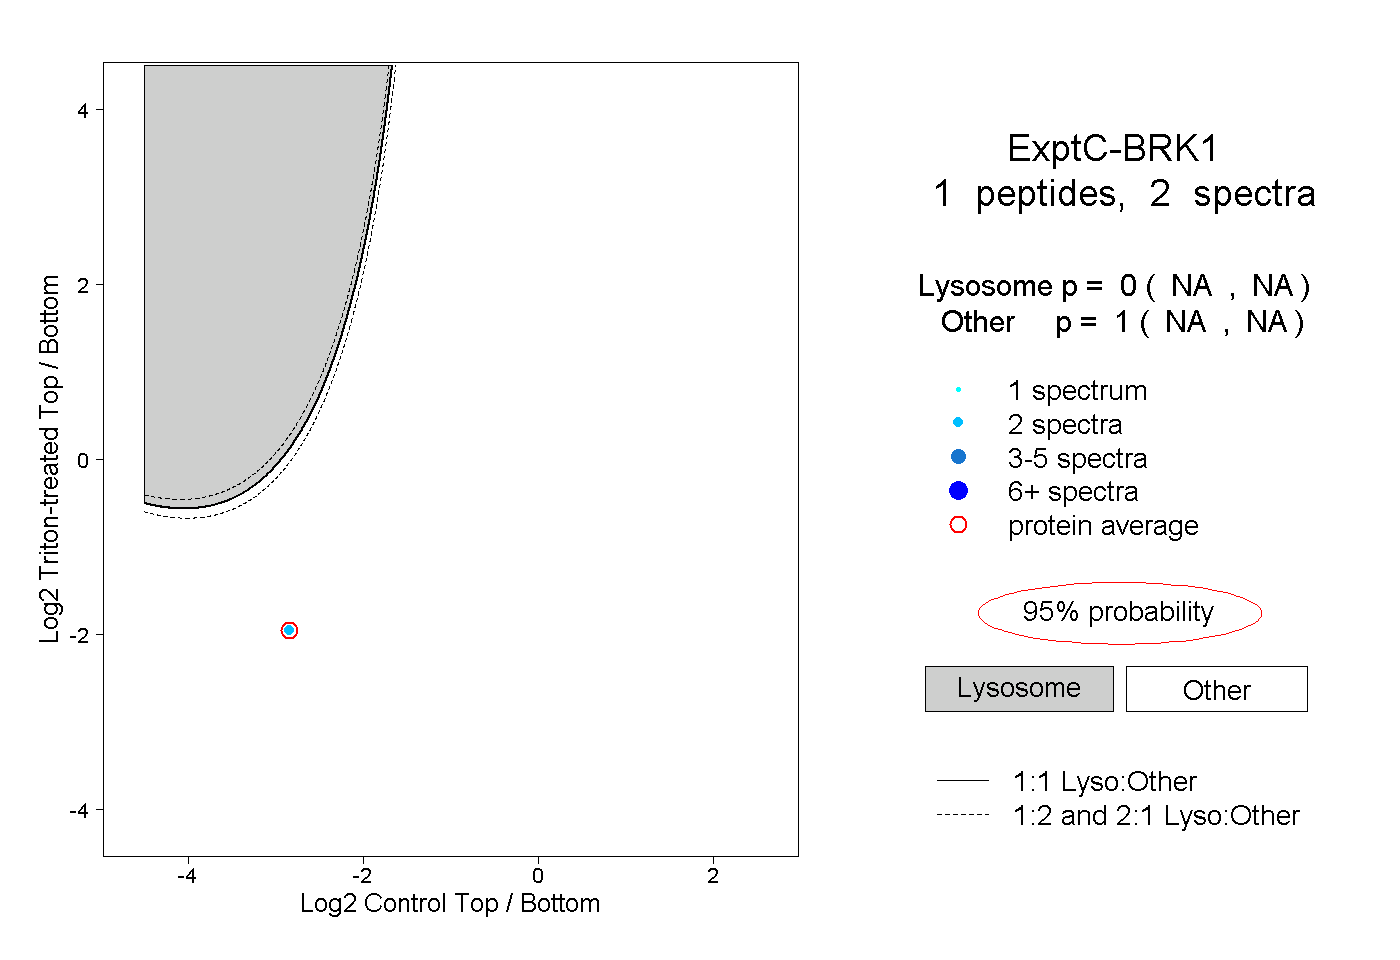 |
0.000 NA | NA |
1.000 NA | NA |