 3
3peptides
spectra
0.000 | 0.000
0.000 | 0.000
0.000 | 0.070
0.000 | 0.136
0.000 | 0.048
0.000 | 0.320
0.506 | 0.606
0.082 | 0.285
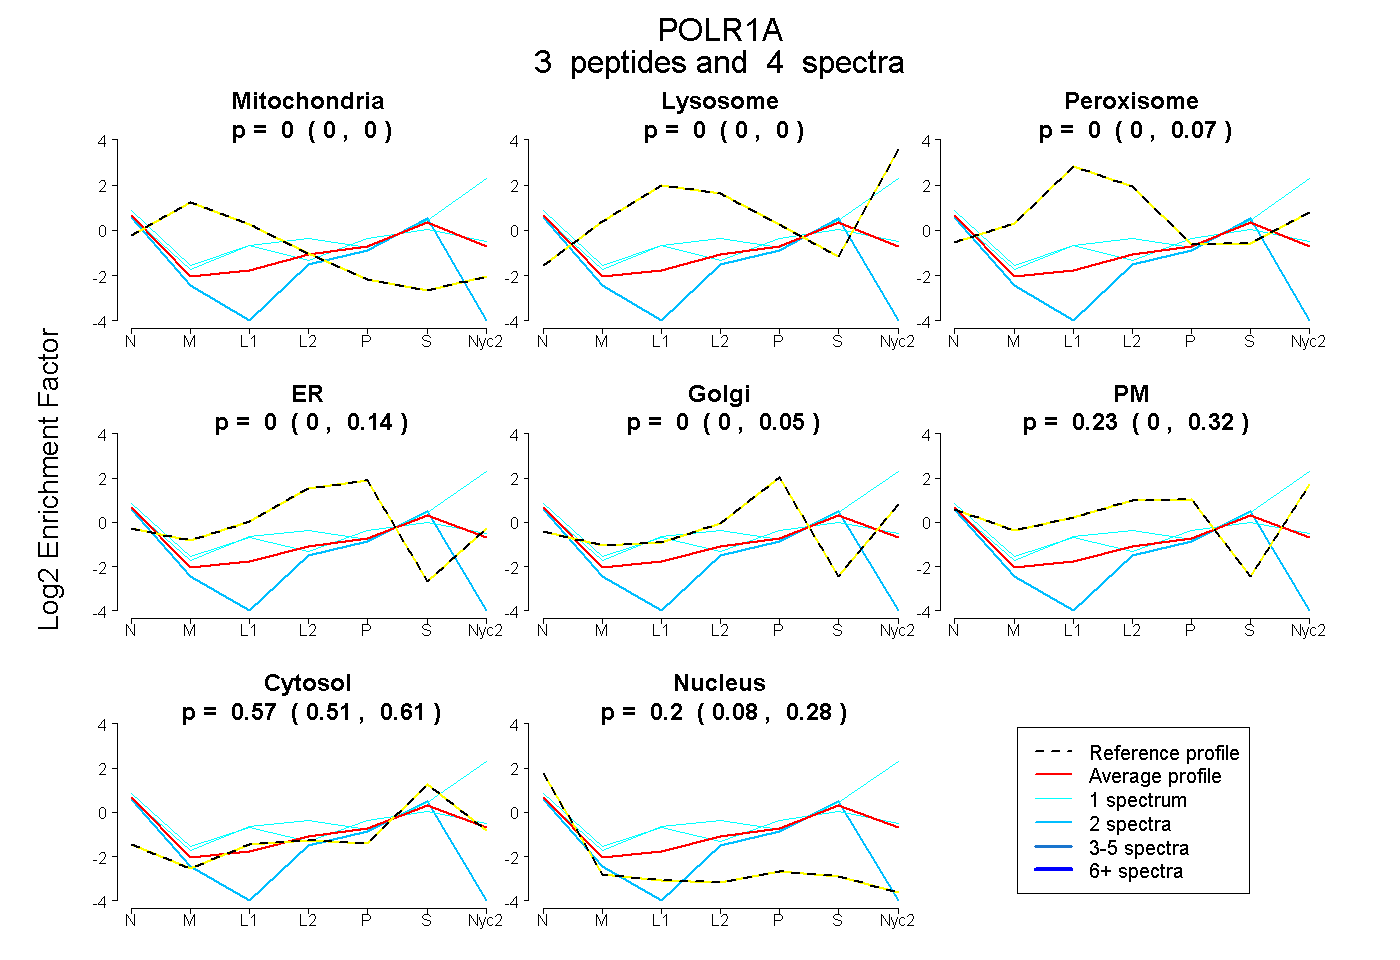
| Plot | Mito | Lyso | Perox | ER | Golgi | PM | Cytosol | Nucleus | |||||
| Expt A |
3 peptides |
4 spectra |
|
0.000 0.000 | 0.000 |
0.000 0.000 | 0.000 |
0.000 0.000 | 0.070 |
0.000 0.000 | 0.136 |
0.000 0.000 | 0.048 |
0.229 0.000 | 0.320 |
0.575 0.506 | 0.606 |
0.196 0.082 | 0.285 |