 7
7peptides
spectra
0.000 | 0.000
0.000 | 0.000
0.000 | 0.051
0.000 | 0.043
0.000 | 0.000
0.000 | 0.000
0.850 | 0.912
0.042 | 0.092
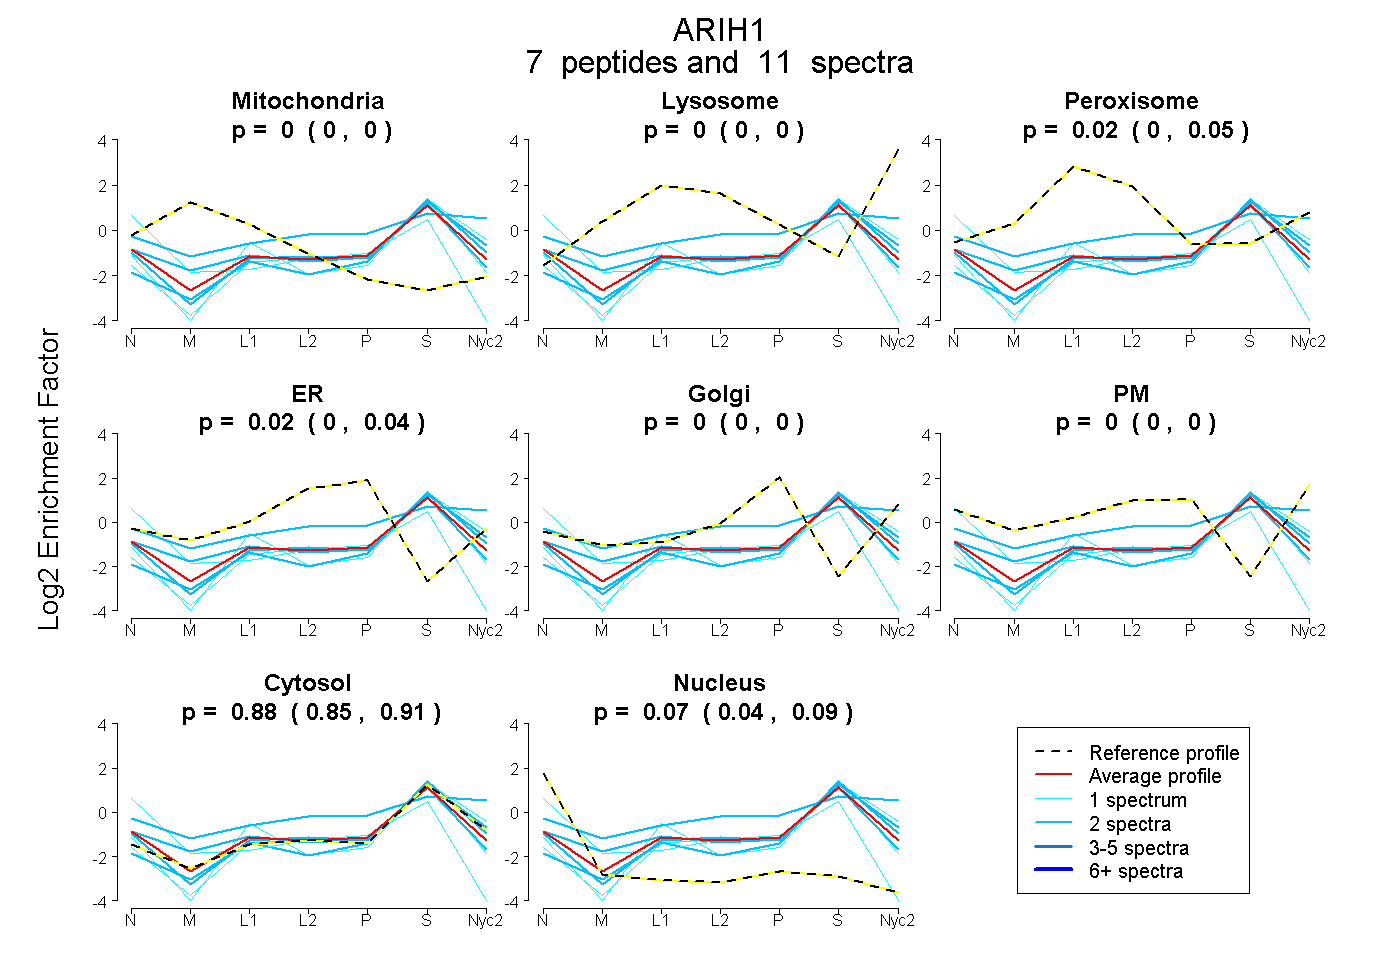
| Plot | Mito | Lyso | Perox | ER | Golgi | PM | Cytosol | Nucleus | |||||
| Expt A |
7 peptides |
11 spectra |
|
0.000 0.000 | 0.000 |
0.000 0.000 | 0.000 |
0.025 0.000 | 0.051 |
0.022 0.000 | 0.043 |
0.000 0.000 | 0.000 |
0.000 0.000 | 0.000 |
0.884 0.850 | 0.912 |
0.068 0.042 | 0.092 |
| 1 spectrum, YCESR | 0.055 | 0.000 | 0.000 | 0.049 | 0.000 | 0.000 | 0.503 | 0.393 | ||
| 2 spectra, VLLQHVHEGYEK | 0.000 | 0.000 | 0.000 | 0.000 | 0.000 | 0.000 | 1.000 | 0.000 | ||
| 2 spectra, YNEDDAK | 0.000 | 0.000 | 0.000 | 0.000 | 0.000 | 0.013 | 0.978 | 0.009 | ||
| 2 spectra, YQHLITNSFVECNR | 0.000 | 0.083 | 0.065 | 0.000 | 0.000 | 0.276 | 0.576 | 0.000 | ||
| 1 spectrum, DISQDSLQDIK | 0.000 | 0.000 | 0.000 | 0.000 | 0.000 | 0.000 | 1.000 | 0.000 | ||
| 2 spectra, YLFYCNR | 0.140 | 0.000 | 0.000 | 0.000 | 0.000 | 0.000 | 0.838 | 0.021 | ||
| 1 spectrum, DGGCNHMVCR | 0.000 | 0.000 | 0.000 | 0.000 | 0.000 | 0.000 | 0.955 | 0.045 |
| Plot | Mito | Lyso or Perox | ER | Golgi | PM | Cytosol | Nucleus | ||||||
| Expt B |
1 peptide |
1 spectrum |
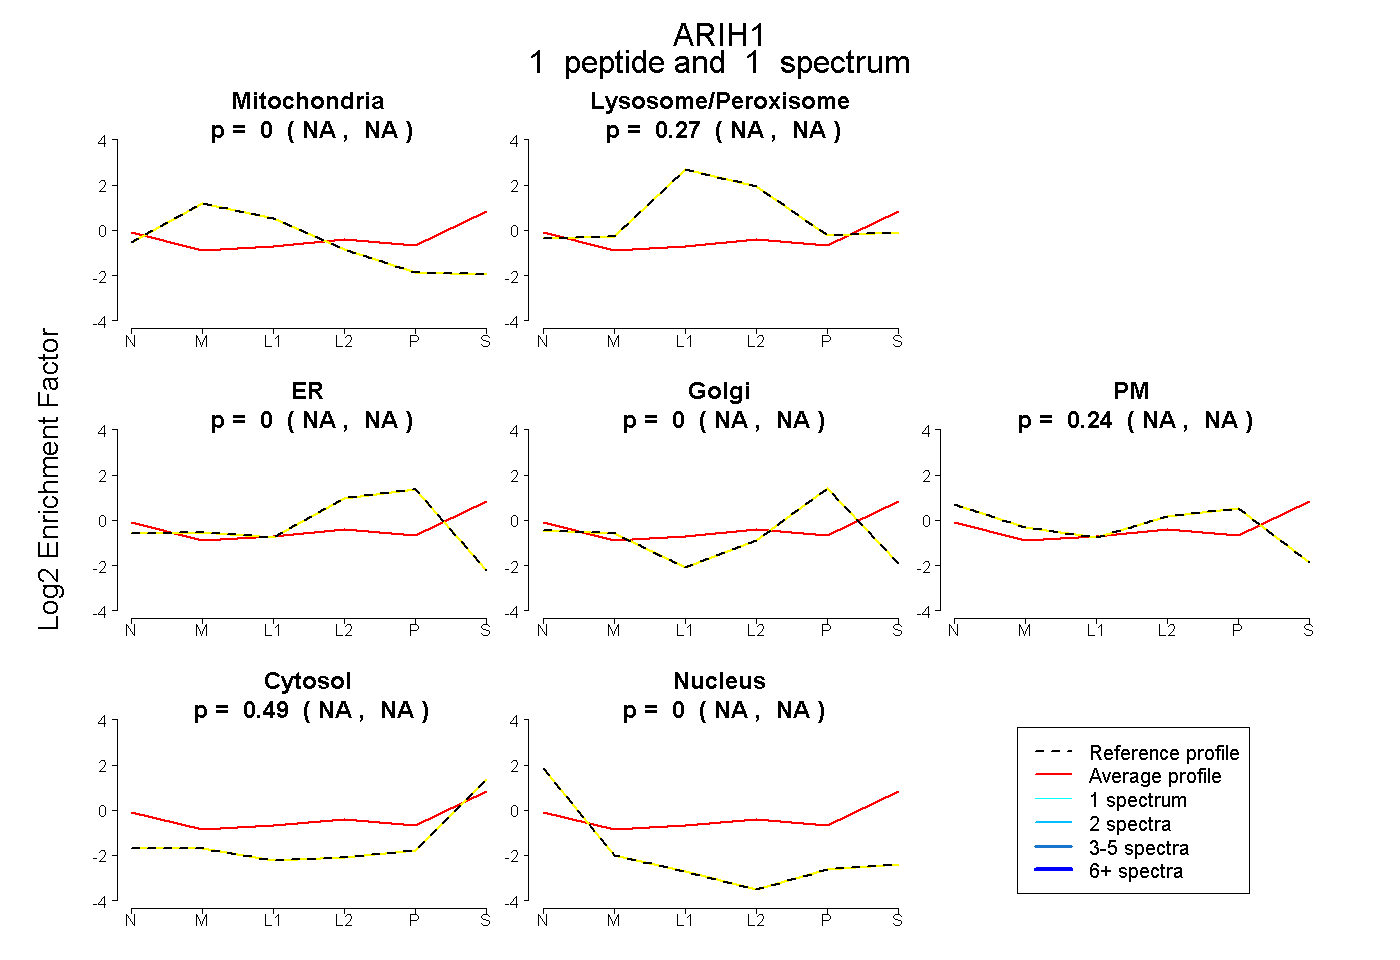 |
0.000 NA | NA |
0.267 NA | NA |
0.000 NA | NA |
0.000 NA | NA |
0.240 NA | NA |
0.493 NA | NA |
0.000 NA | NA |
|||
| Plot | Lyso | Other | |||||||||||
| Expt C |
4 peptides |
13 spectra |
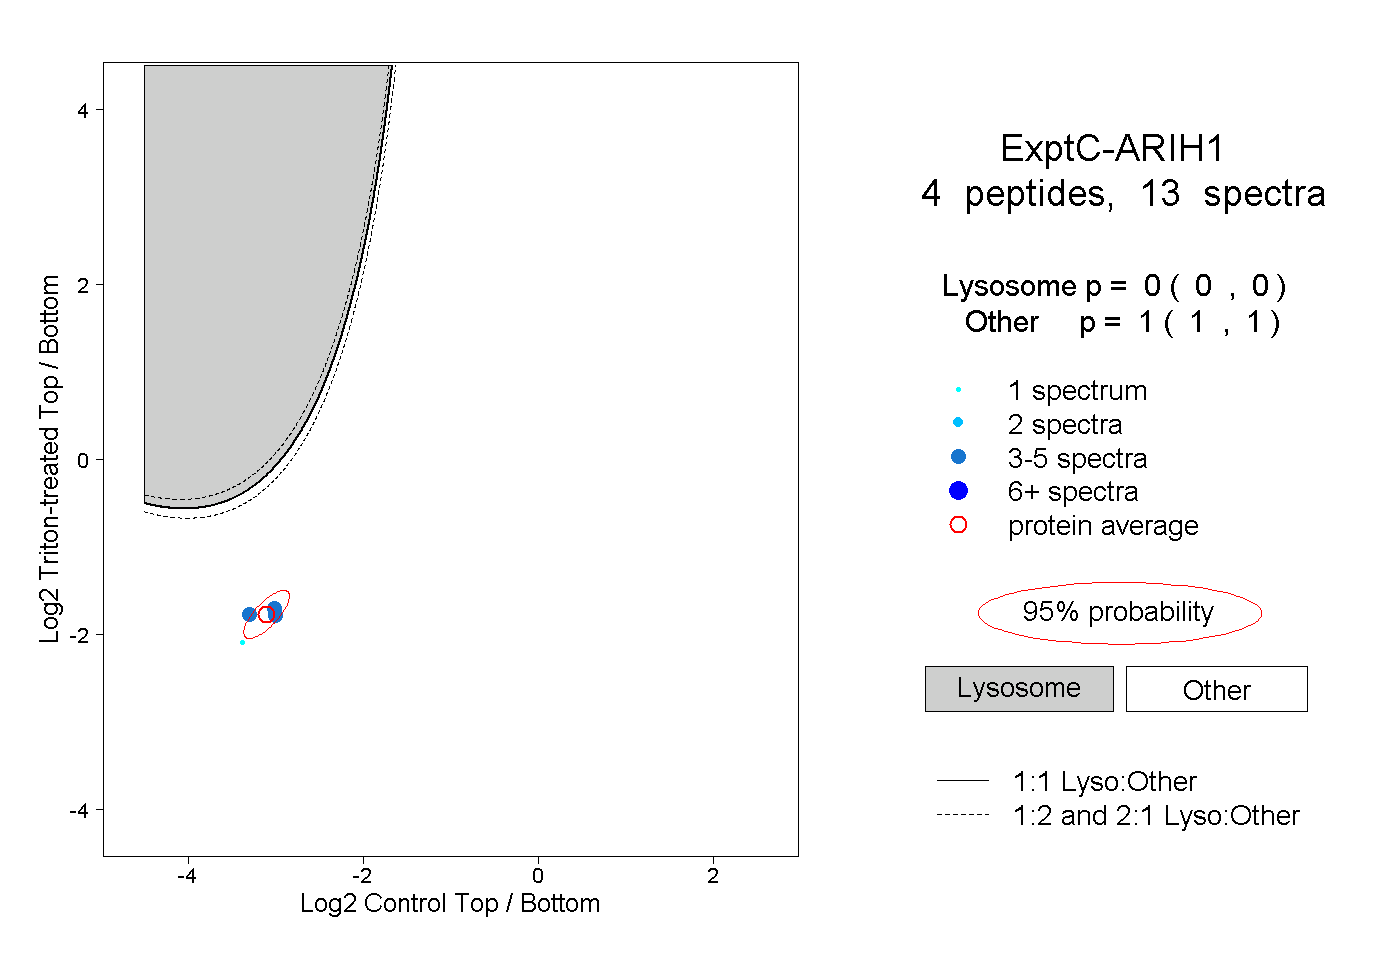 |
0.000 0.000 | 0.000 |
1.000 1.000 | 1.000 |
||||||||
| Plot | Lyso | Other | |||||||||||
| Expt D |
1 peptide |
1 spectrum |
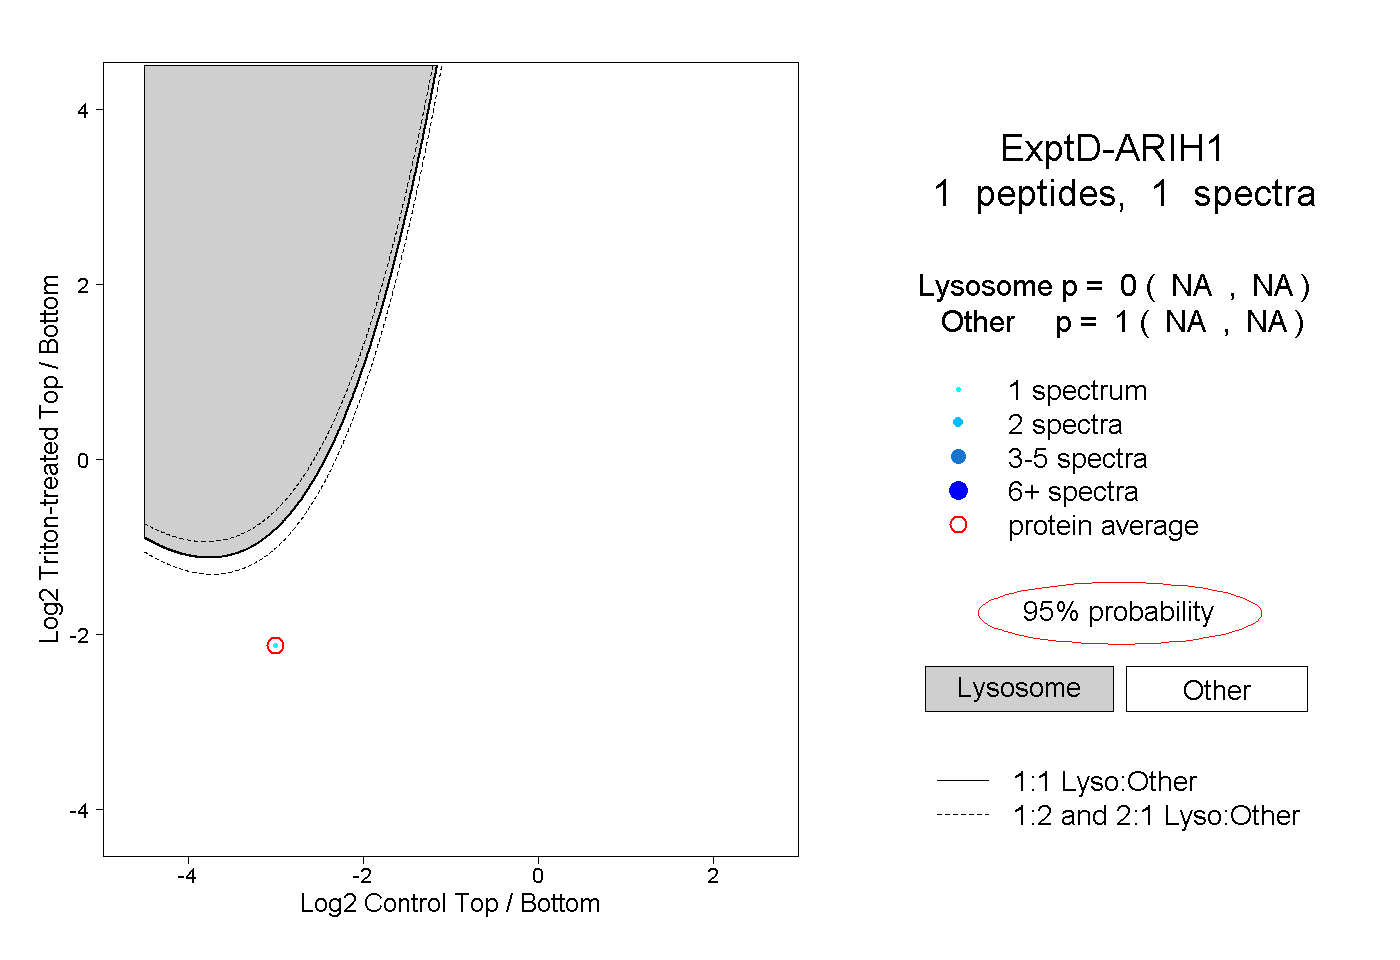 |
0.000 NA | NA |
1.000 NA | NA |