 3
3peptides
spectra
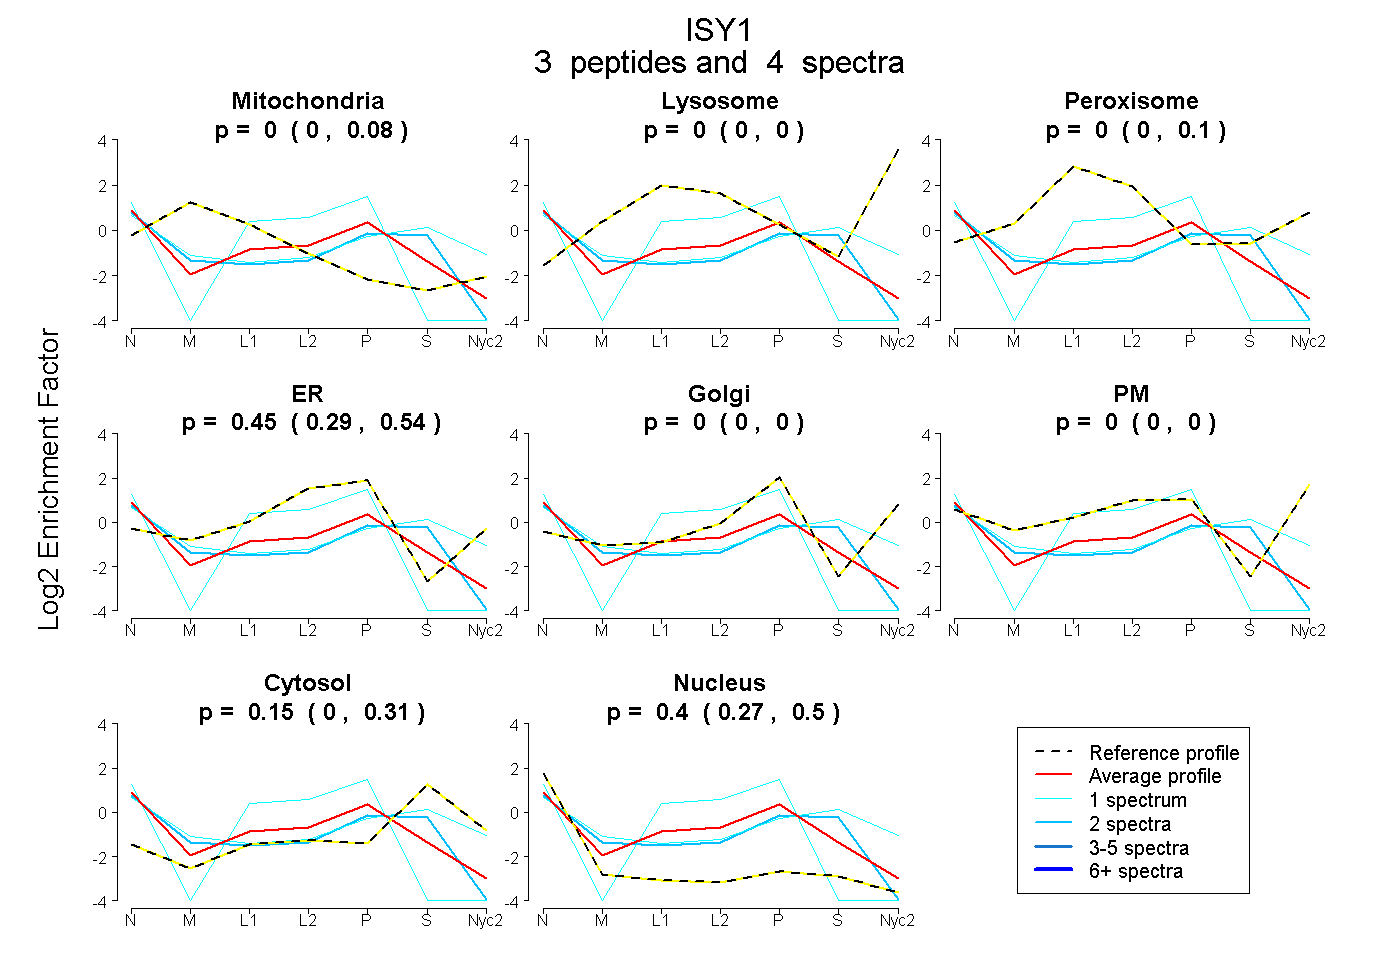
0.000 | 0.077
0.000 | 0.000
0.000 | 0.100
0.290 | 0.539
0.000 | 0.000
0.000 | 0.000
0.000 | 0.313
0.269 | 0.497
| Plot | Mito | Lyso | Perox | ER | Golgi | PM | Cytosol | Nucleus | |||||
| Expt A |
3 peptides |
4 spectra |
|
0.000 0.000 | 0.077 |
0.000 0.000 | 0.000 |
0.000 0.000 | 0.100 |
0.454 0.290 | 0.539 |
0.000 0.000 | 0.000 |
0.000 0.000 | 0.000 |
0.147 0.000 | 0.313 |
0.399 0.269 | 0.497 |
| 1 spectrum, EPLPPPR | 0.000 | 0.000 | 0.000 | 0.617 | 0.000 | 0.000 | 0.000 | 0.383 | ||
| 2 spectra, AMTALAR | 0.072 | 0.000 | 0.000 | 0.204 | 0.000 | 0.000 | 0.316 | 0.408 | ||
| 1 spectrum, RPFLASECTELPK | 0.045 | 0.000 | 0.000 | 0.000 | 0.040 | 0.250 | 0.481 | 0.183 |
| Plot | Lyso | Other | |||||||||||
| Expt C |
4 peptides |
5 spectra |
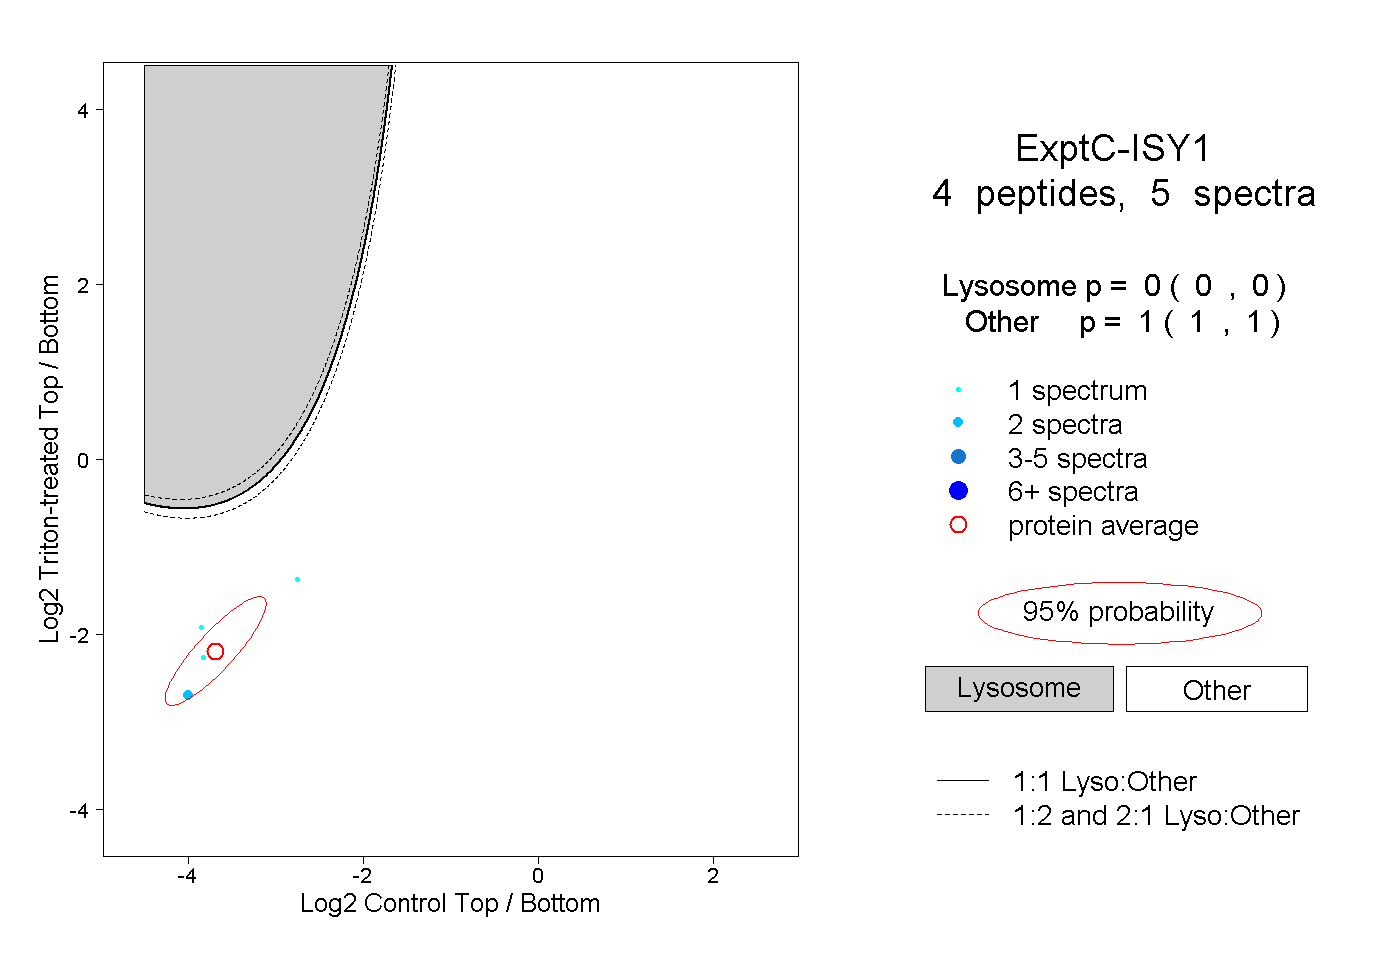 |
0.000 0.000 | 0.000 |
1.000 1.000 | 1.000 |