 7
7peptides
spectra
0.000 | 0.000
0.000 | 0.000
0.000 | 0.000
0.000 | 0.000
0.000 | 0.000
0.000 | 0.000
0.471 | 0.501
0.496 | 0.526
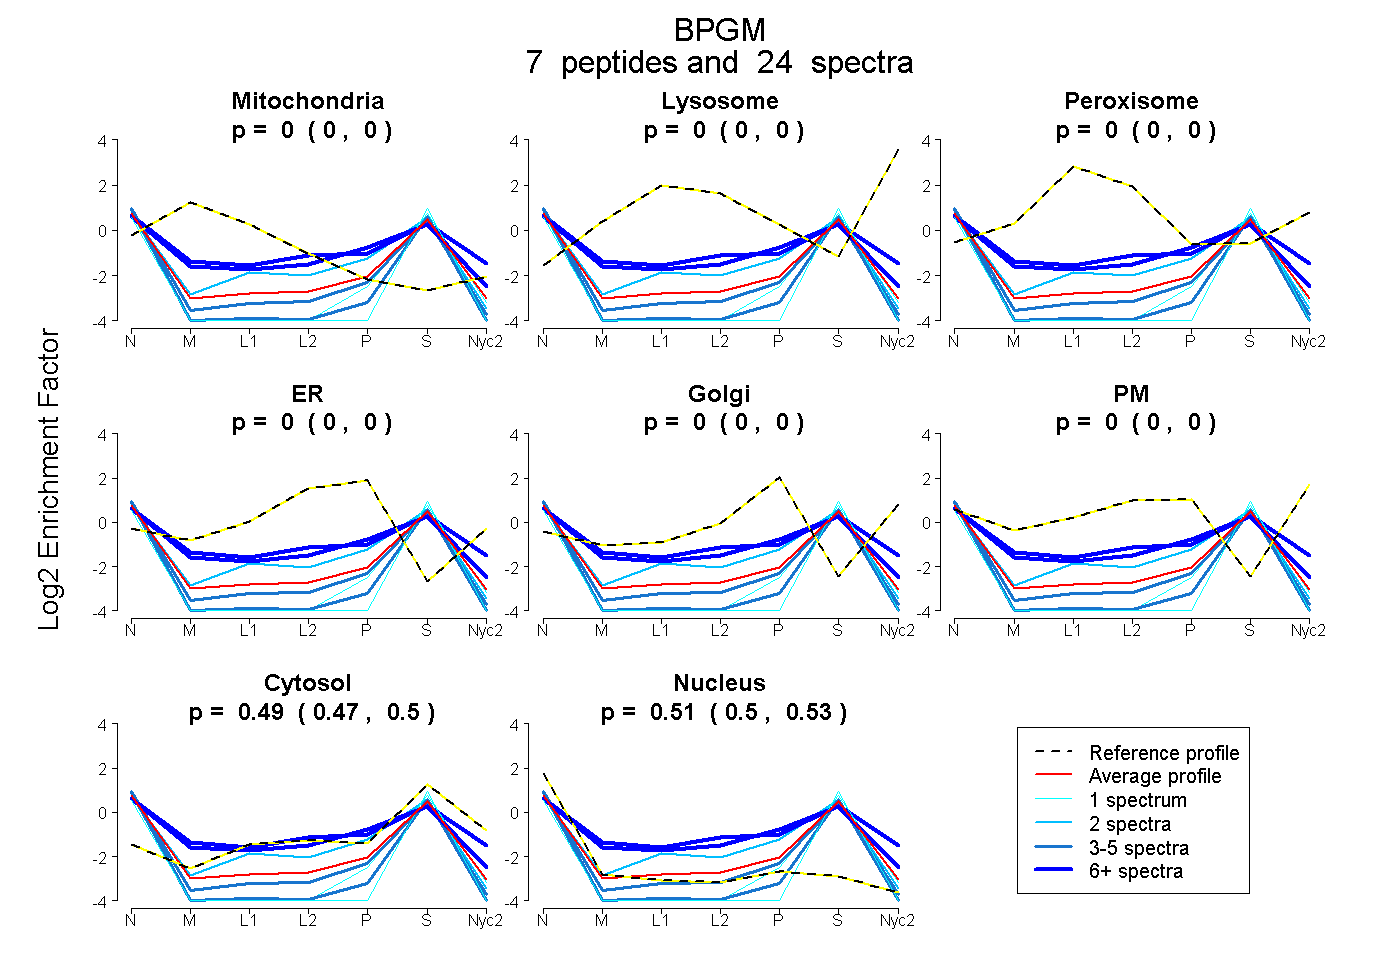
| Plot | Mito | Lyso | Perox | ER | Golgi | PM | Cytosol | Nucleus | |||||
| Expt A |
7 peptides |
24 spectra |
|
0.000 0.000 | 0.000 |
0.000 0.000 | 0.000 |
0.000 0.000 | 0.000 |
0.000 0.000 | 0.000 |
0.000 0.000 | 0.000 |
0.000 0.000 | 0.000 |
0.487 0.471 | 0.501 |
0.513 0.496 | 0.526 |
| 6 spectra, MALNHGEEQVR | 0.050 | 0.000 | 0.000 | 0.121 | 0.000 | 0.000 | 0.518 | 0.312 | ||
| 3 spectra, LLPYWK | 0.000 | 0.000 | 0.000 | 0.000 | 0.000 | 0.000 | 0.286 | 0.714 | ||
| 1 spectrum, ISPEILK | 0.000 | 0.000 | 0.000 | 0.000 | 0.000 | 0.000 | 0.379 | 0.621 | ||
| 1 spectrum, VCDVPLDQLPR | 0.000 | 0.000 | 0.000 | 0.000 | 0.000 | 0.000 | 0.317 | 0.683 | ||
| 7 spectra, HYGALIGLNR | 0.021 | 0.000 | 0.088 | 0.000 | 0.000 | 0.119 | 0.509 | 0.263 | ||
| 4 spectra, LNSDGLEEAR | 0.000 | 0.000 | 0.000 | 0.000 | 0.000 | 0.000 | 0.380 | 0.620 | ||
| 2 spectra, HGEGQWNK | 0.000 | 0.000 | 0.000 | 0.000 | 0.000 | 0.000 | 0.559 | 0.441 |
| Plot | Mito | Lyso or Perox | ER | Golgi | PM | Cytosol | Nucleus | ||||||
| Expt B |
3 peptides |
10 spectra |
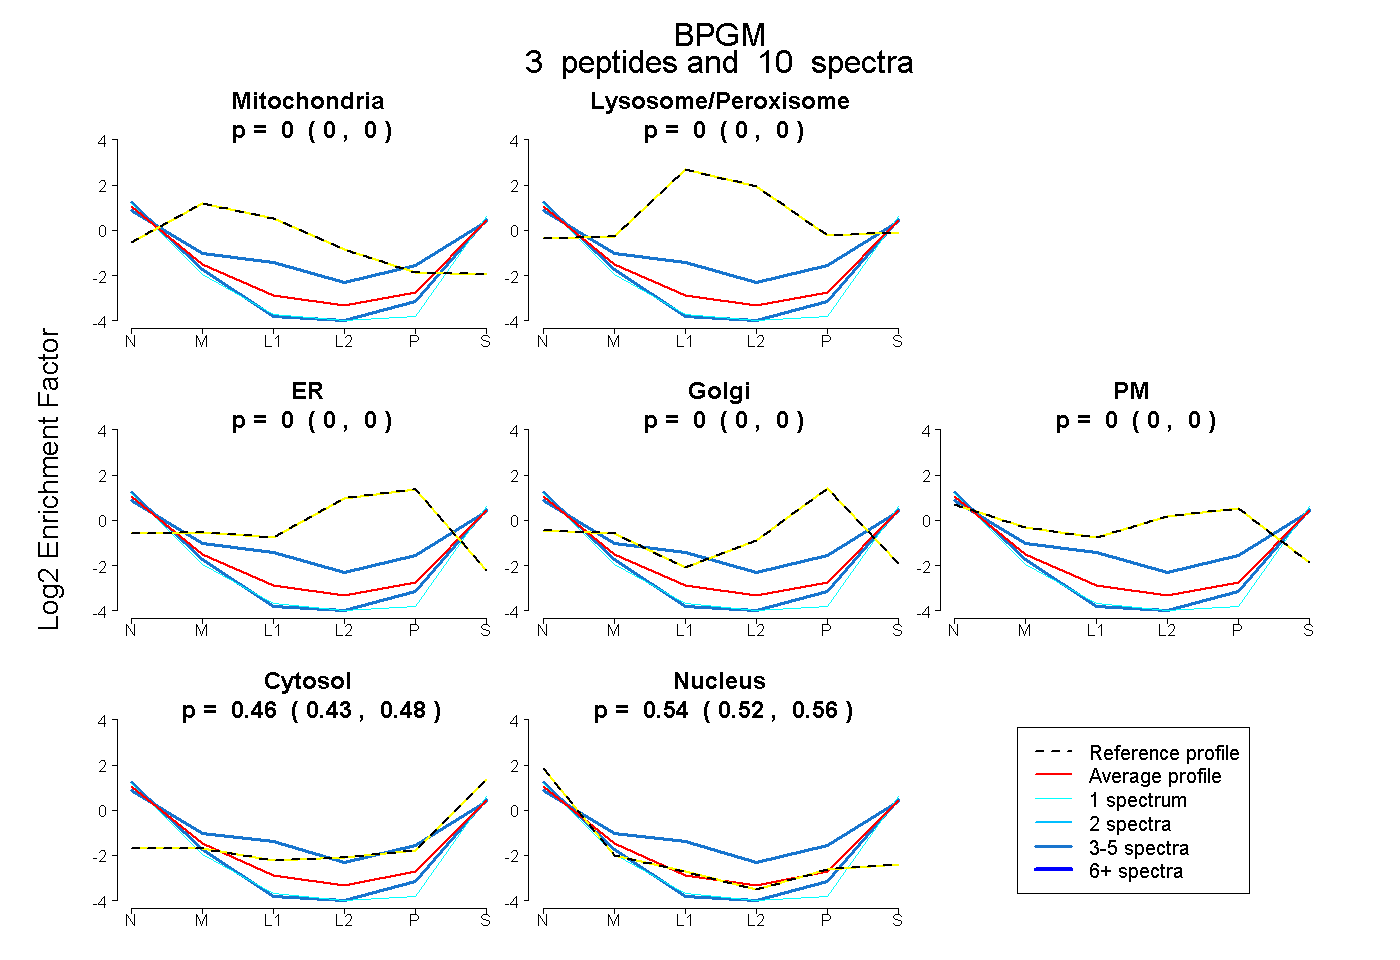 |
0.000 0.000 | 0.000 |
0.000 0.000 | 0.000 |
0.000 0.000 | 0.000 |
0.000 0.000 | 0.000 |
0.000 0.000 | 0.000 |
0.457 0.432 | 0.479 |
0.543 0.517 | 0.564 |
|||
| Plot | Lyso | Other | |||||||||||
| Expt C |
1 peptide |
1 spectrum |
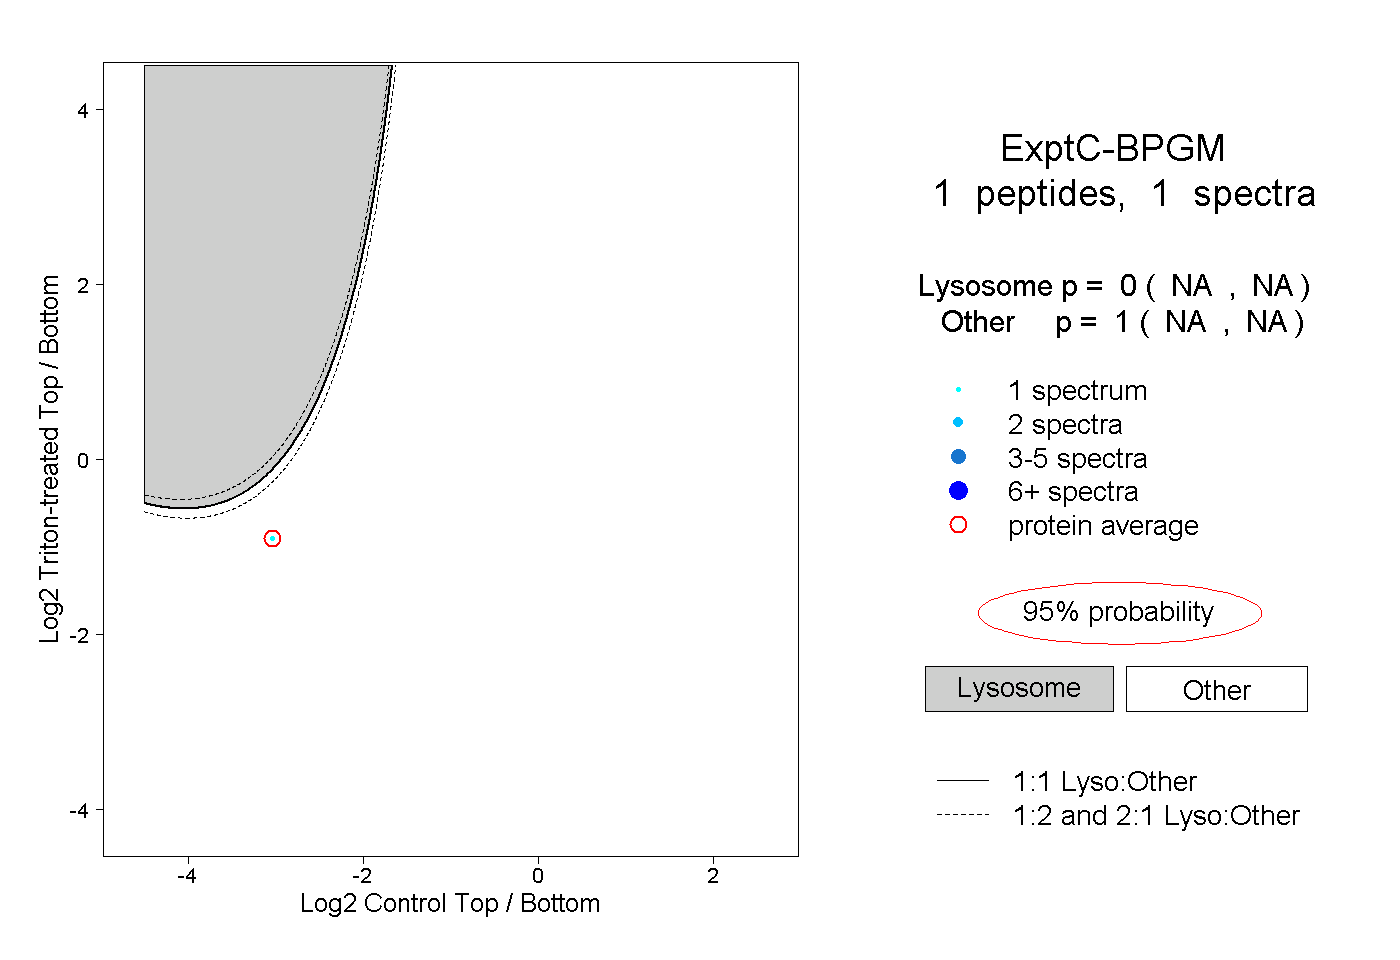 |
0.000 NA | NA |
1.000 NA | NA |