 5
5peptides
spectra
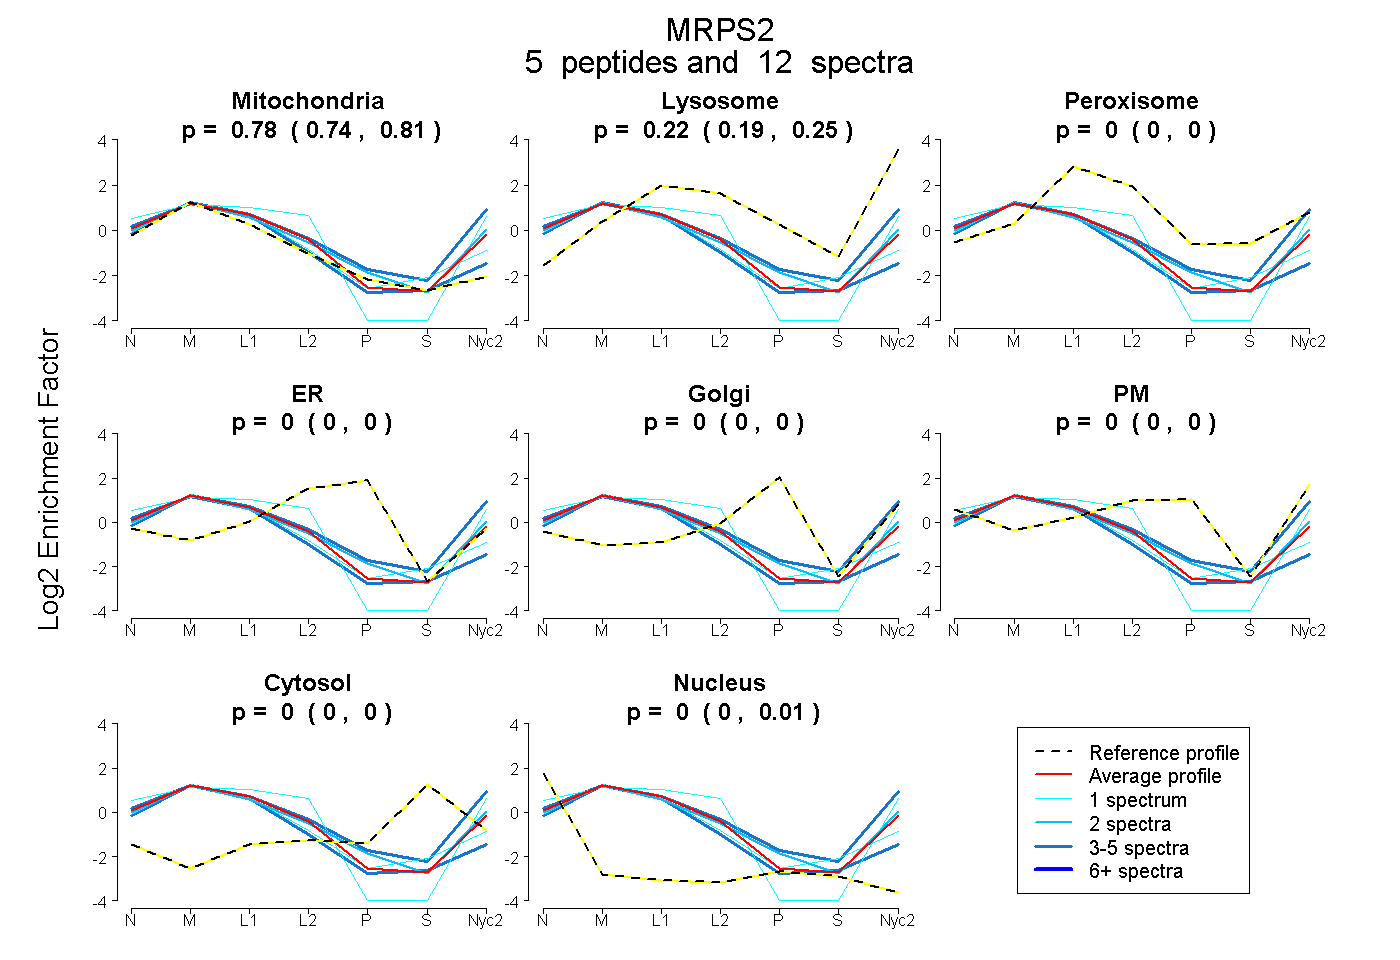
0.737 | 0.807
0.188 | 0.251
0.000 | 0.000
0.000 | 0.000
0.000 | 0.000
0.000 | 0.002
0.000 | 0.000
0.000 | 0.006
3peptides
spectra
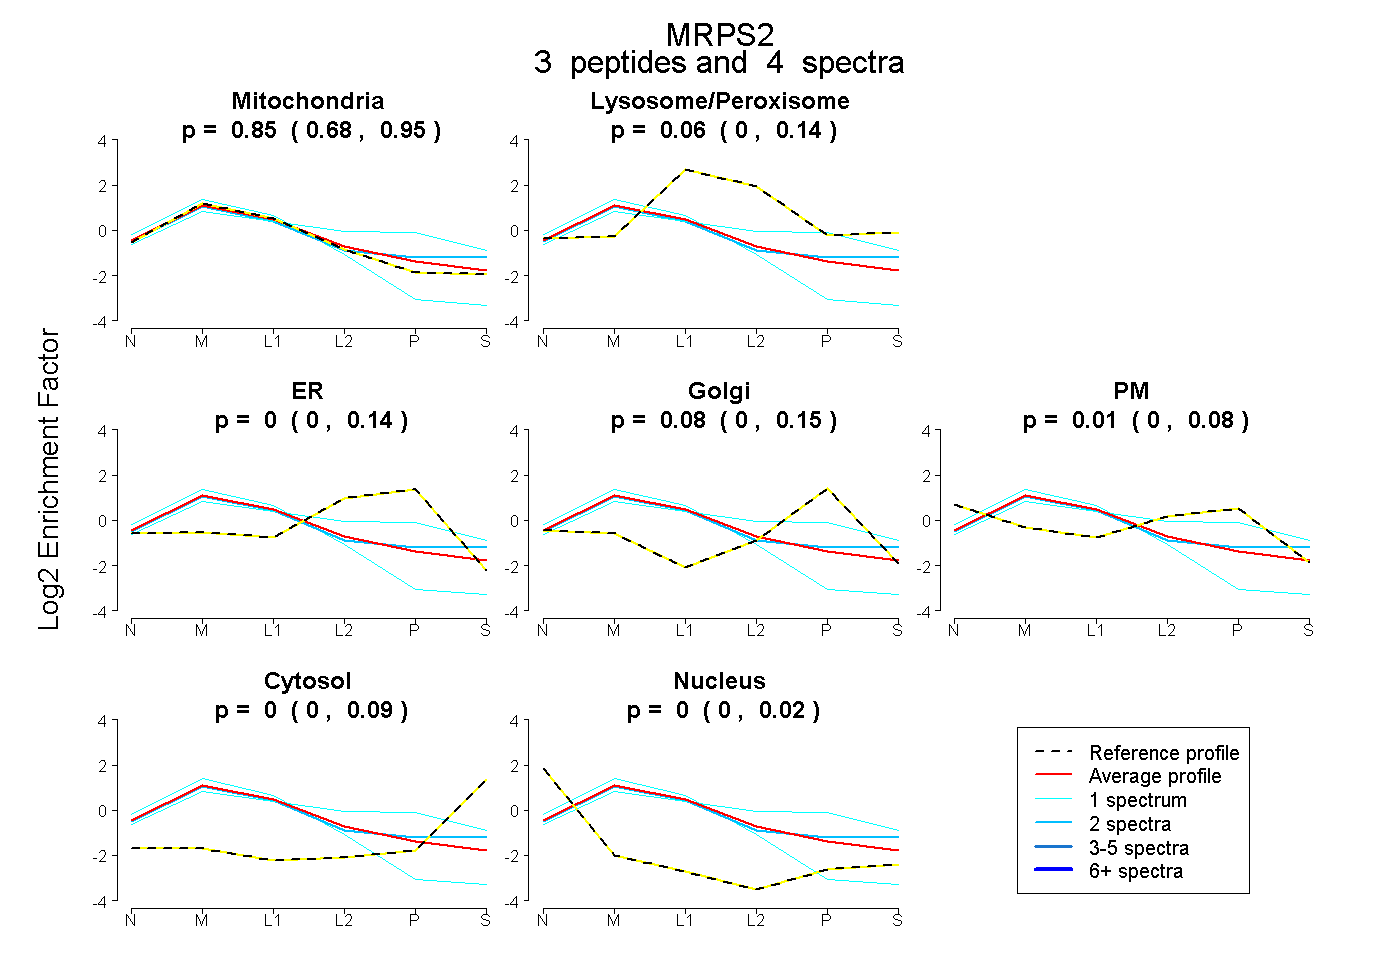
0.678 | 0.947
0.000 | 0.136
0.000 | 0.138
0.000 | 0.155
0.000 | 0.082
0.000 | 0.091
0.000 | 0.022
7peptides
spectra
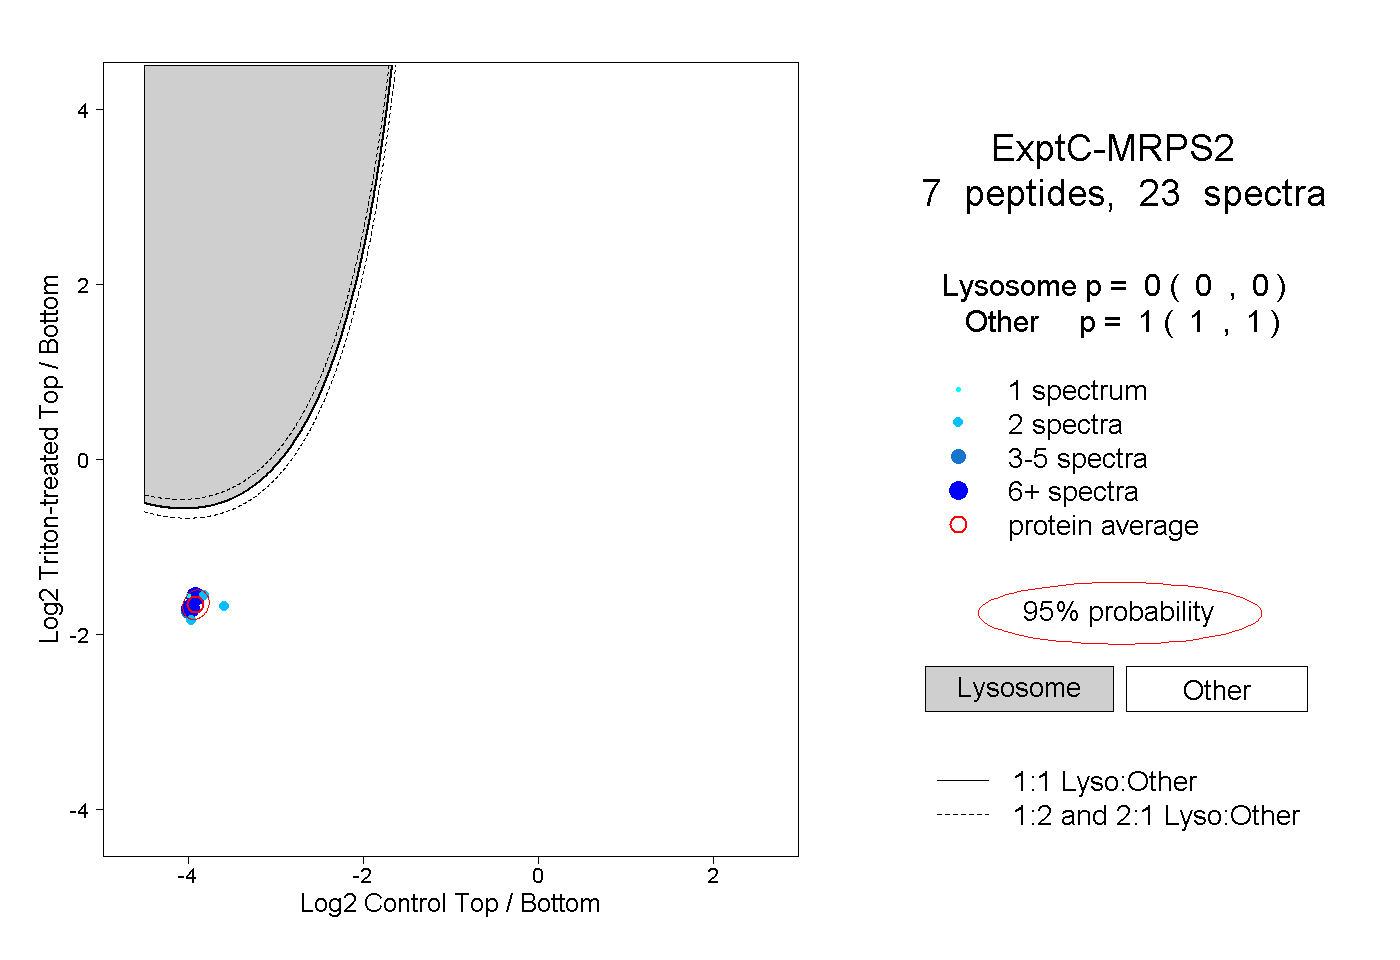
0.000 | 0.000
1.000 | 1.000
1peptide
spectrum
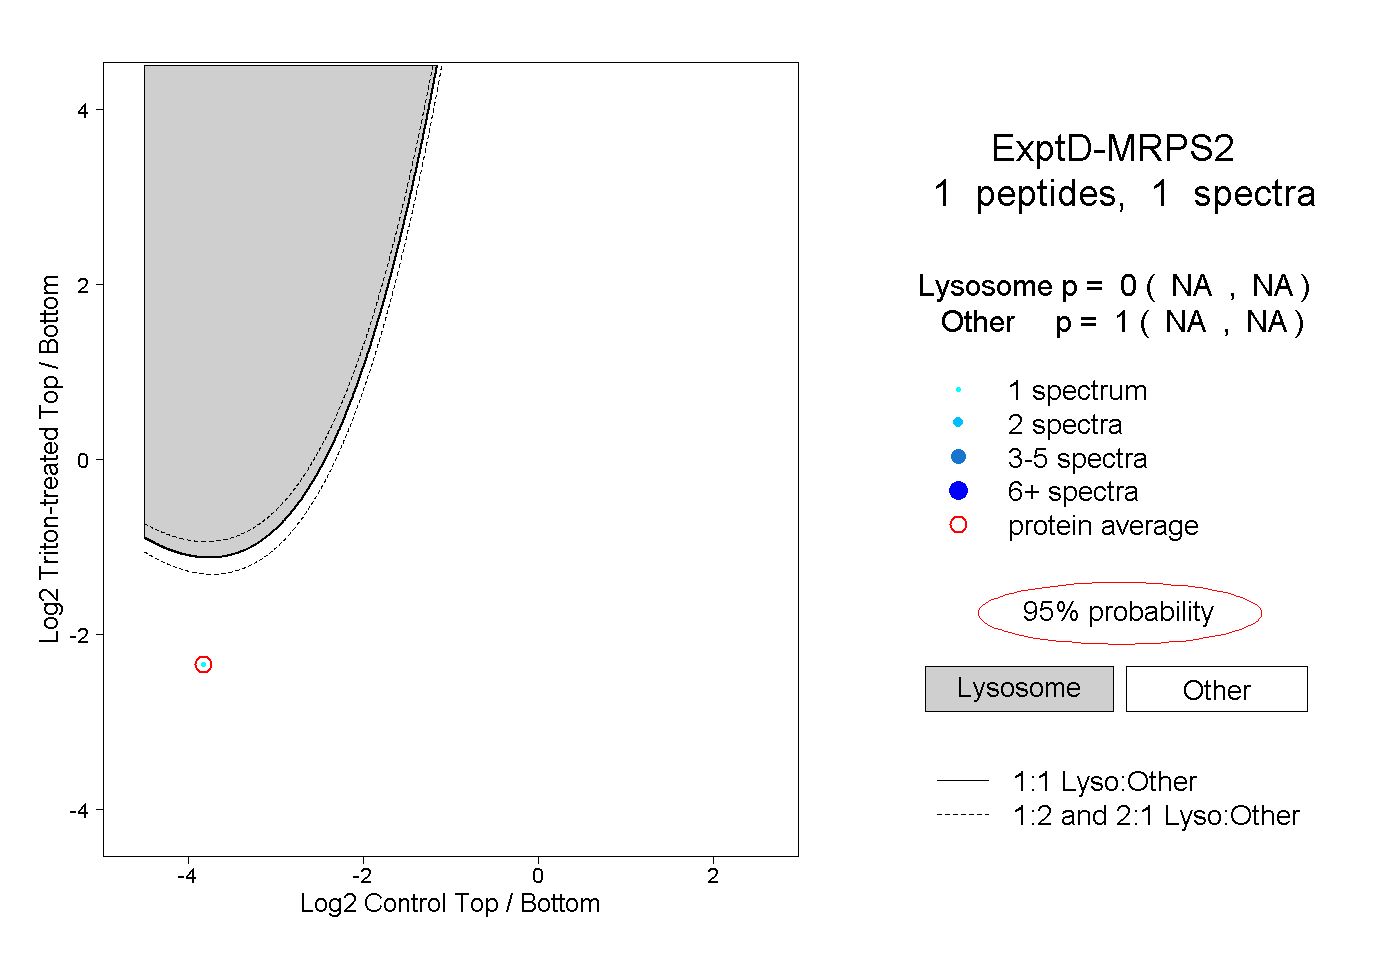
NA | NA
NA | NA