 14
14peptides
spectra
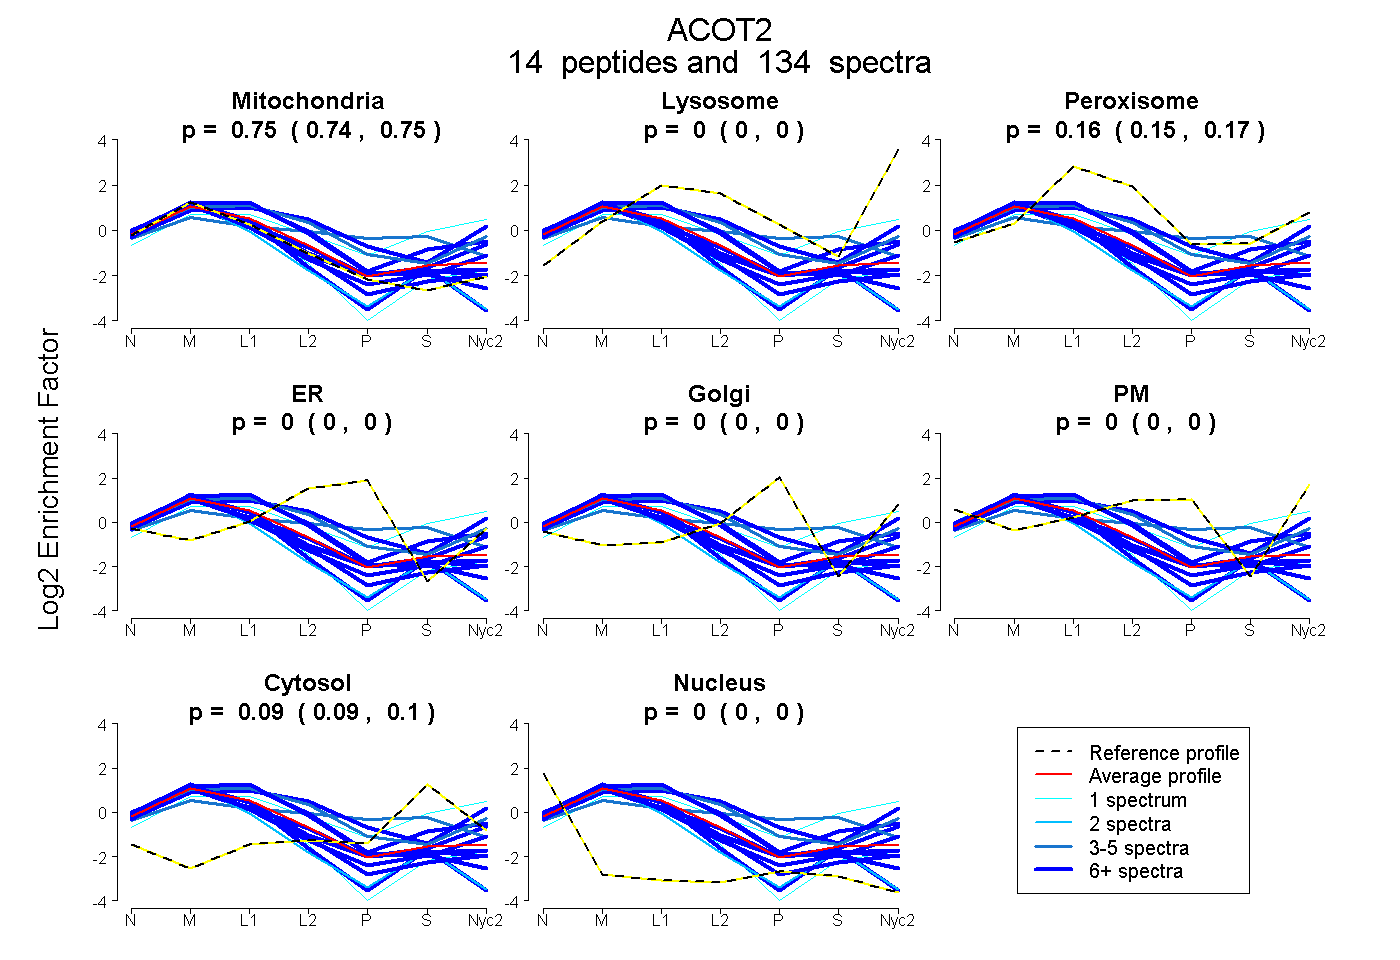
0.738 | 0.751
0.000 | 0.000
0.153 | 0.166
0.000 | 0.000
0.000 | 0.000
0.000 | 0.000
0.091 | 0.098
0.000 | 0.000
13peptides
spectra
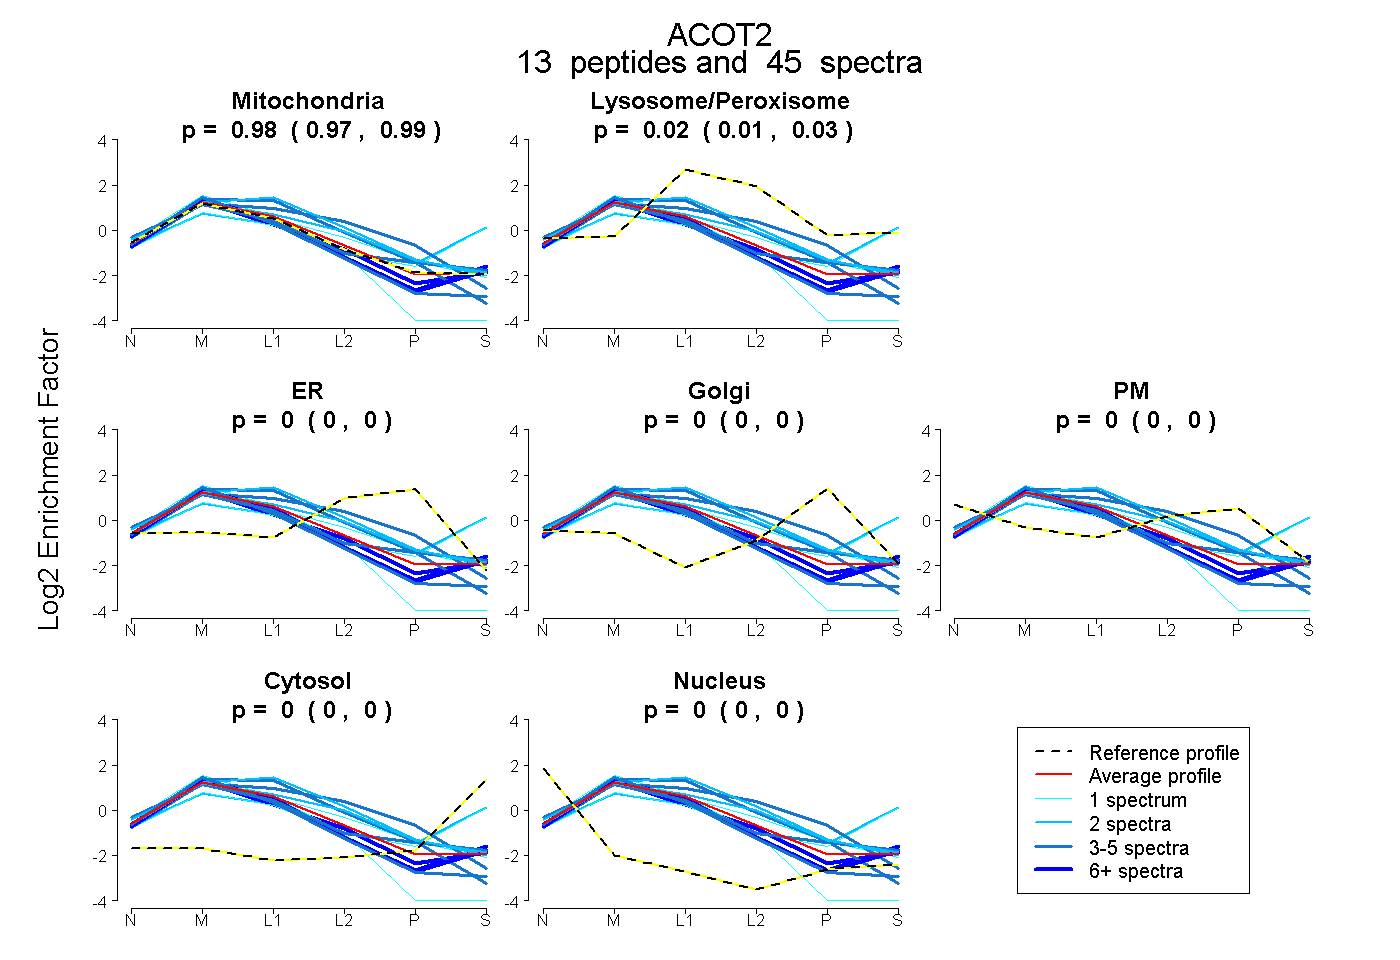
0.968 | 0.989
0.008 | 0.030
0.000 | 0.000
0.000 | 0.000
0.000 | 0.000
0.000 | 0.000
0.000 | 0.000
16peptides
spectra
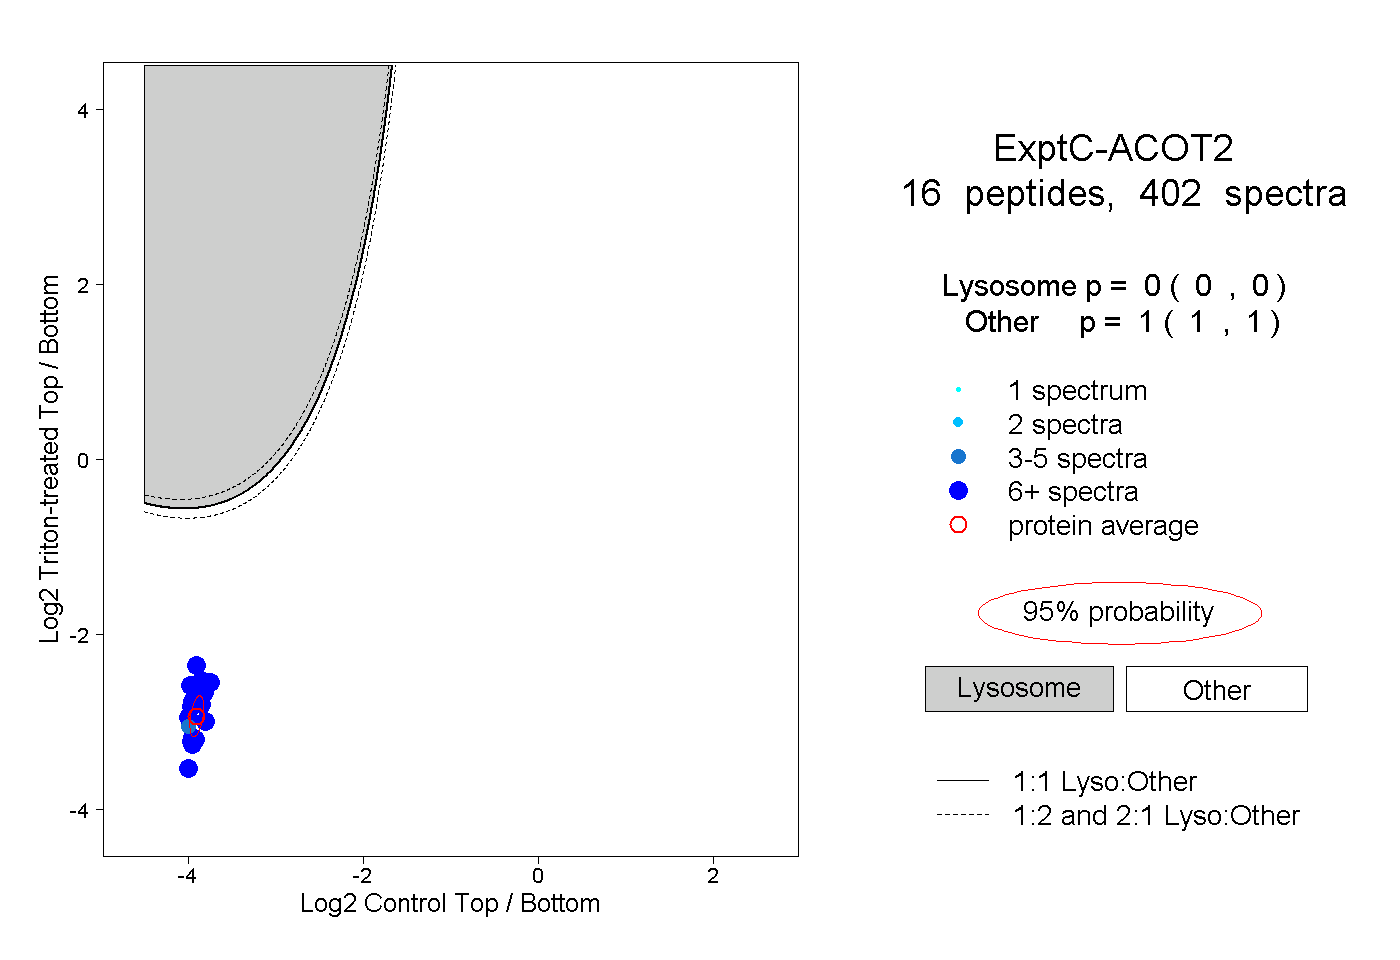
0.000 | 0.000
1.000 | 1.000
10peptides
spectra
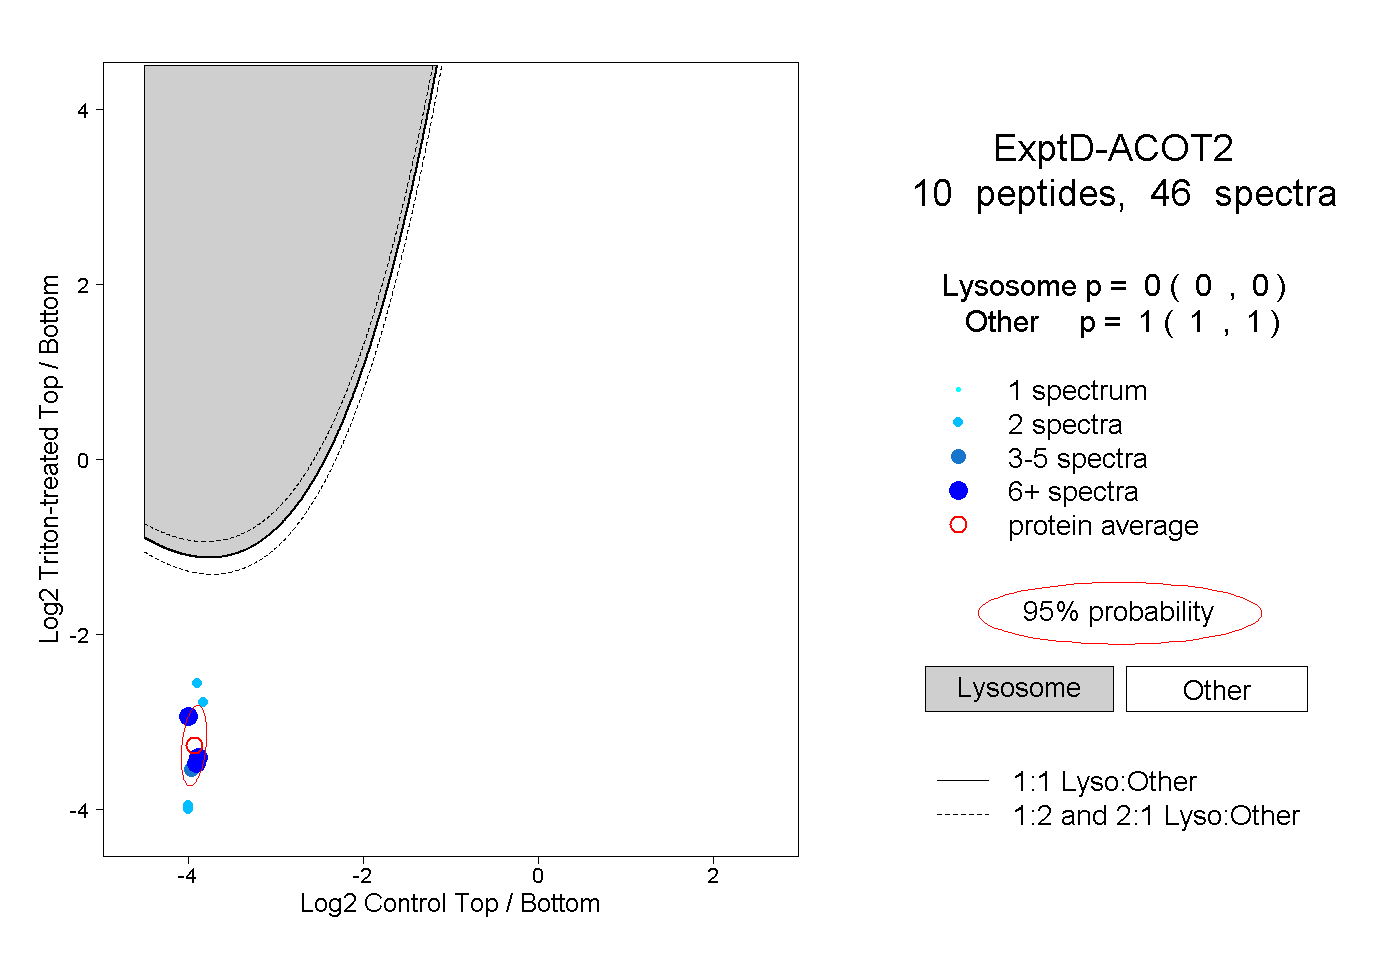
0.000 | 0.000
1.000 | 1.000