 2
2peptides
spectra
0.000 | 0.100
0.000 | 0.451
0.000 | 0.332
0.000 | 0.067
0.000 | 0.198
0.000 | 0.188
0.426 | 0.595
0.000 | 0.000
1peptide
spectra
NA | NA
NA | NA
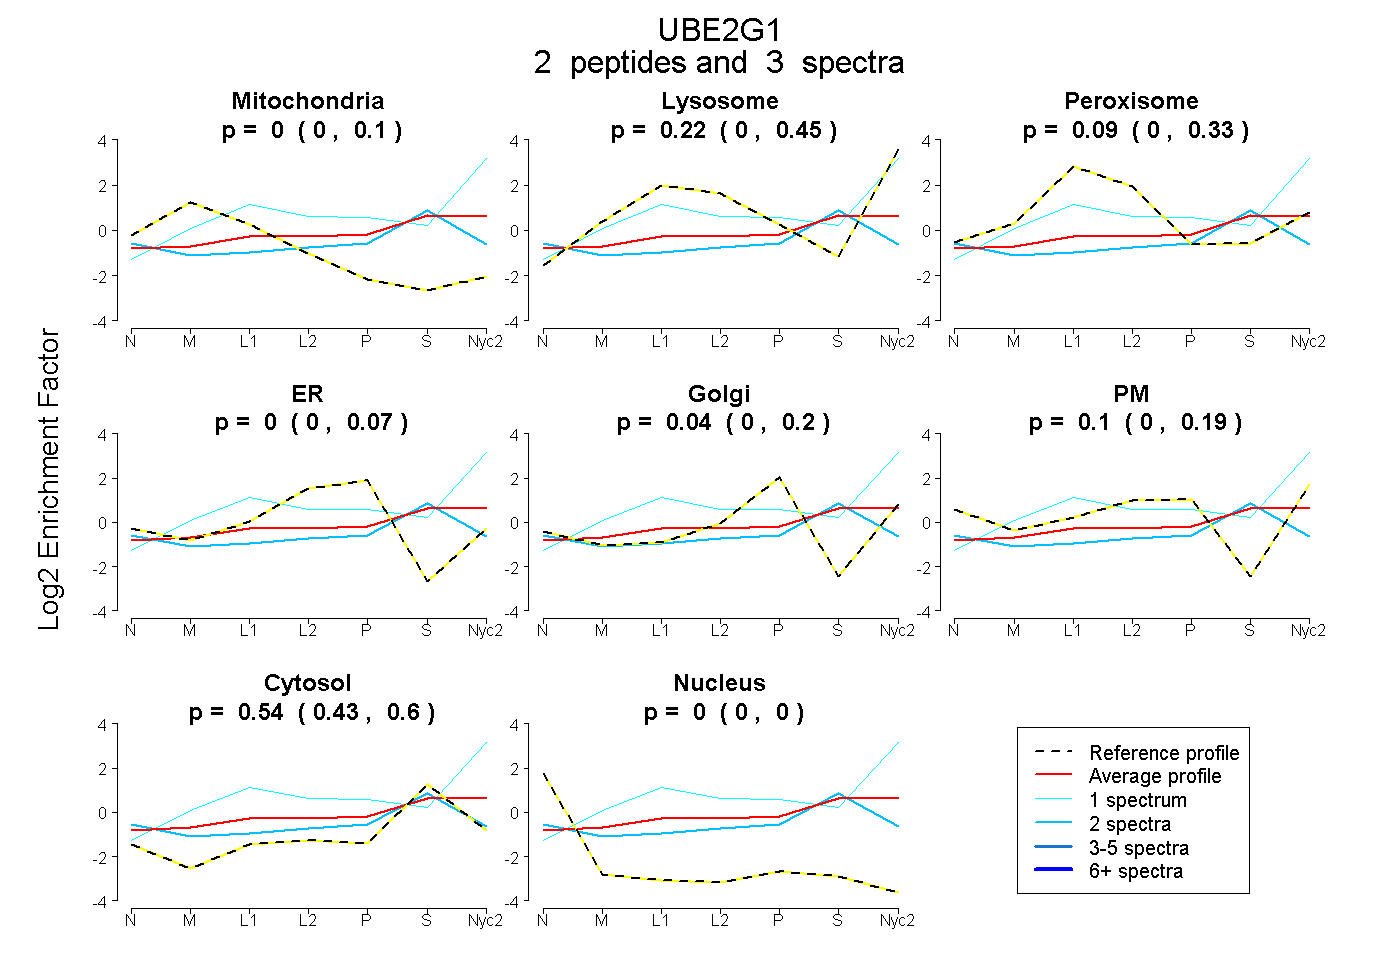
| Plot | Mito | Lyso | Perox | ER | Golgi | PM | Cytosol | Nucleus | |||||
| Expt A |
2 peptides |
3 spectra |
|
0.000 0.000 | 0.100 |
0.218 0.000 | 0.451 |
0.092 0.000 | 0.332 |
0.000 0.000 | 0.067 |
0.043 0.000 | 0.198 |
0.103 0.000 | 0.188 |
0.544 0.426 | 0.595 |
0.000 0.000 | 0.000 |
||
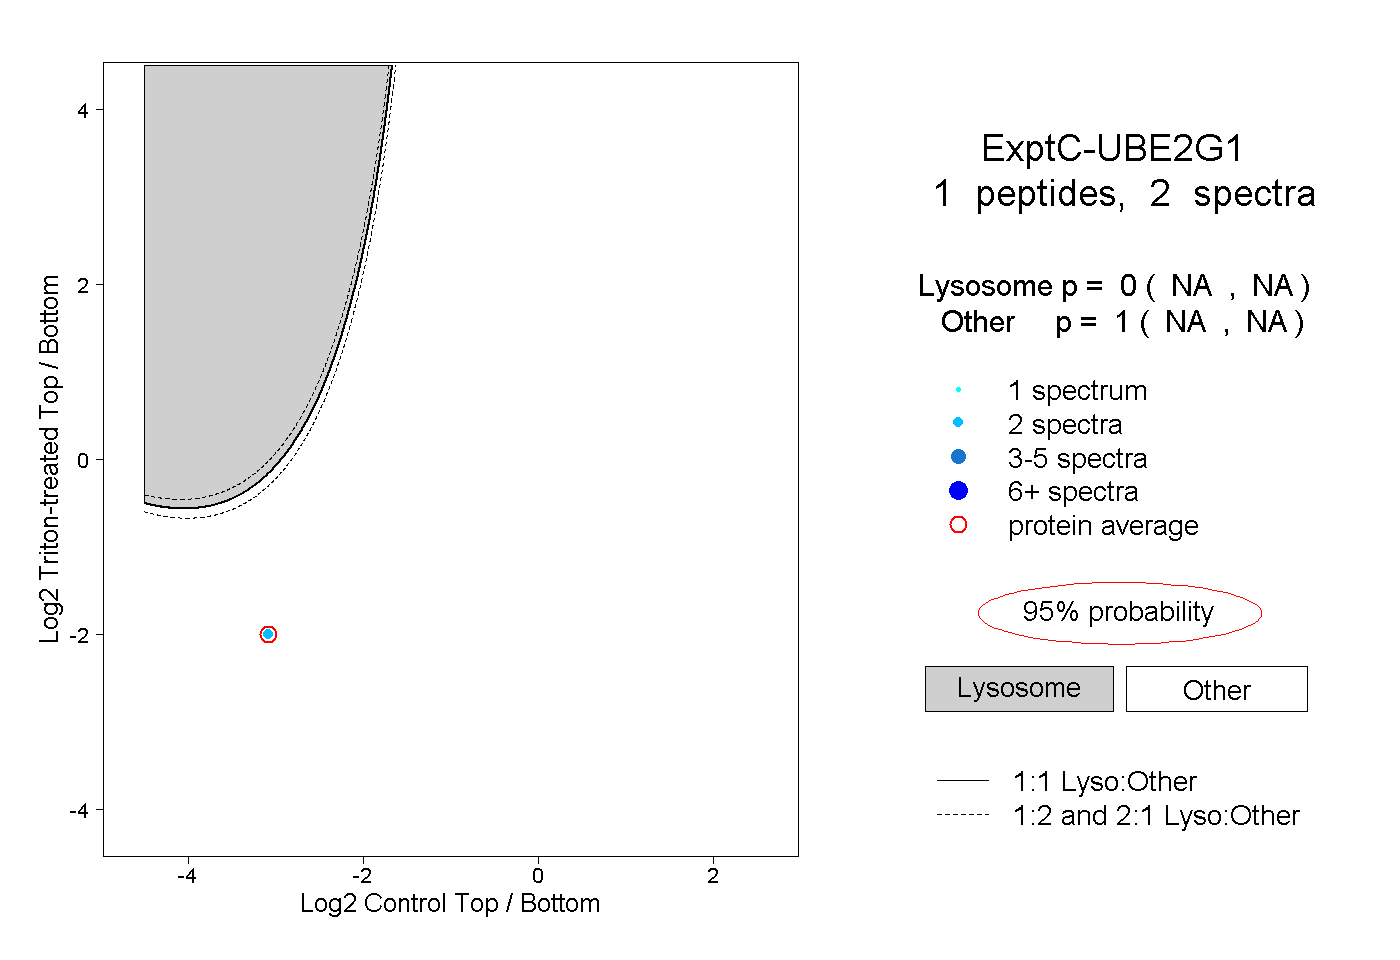
| Plot | Lyso | Other | |||||||||||
| Expt C |
1 peptide |
2 spectra |
|
0.000 NA | NA |
1.000 NA | NA |